
Translated from the original Traditional Chinese post. Read the Chinese original →
Can a VPC be the little soldier who wins the battle?
Let's see why a VPC can be the little soldier who wins the battle
A VPC originates in the ventricle. Like LBBB, a VPC has discordant ST segments, so when there's excessive discordant STE or concordant STE, you need to be careful. There's no evidence that the MSC applies to VPCs the way it applies to LBBB. But in Stephen Smith's experience, the rule works for VPCs very much the way it does for LBBB, though it's a bit less specific1.
Let's review. The Modified Sgarbossa criteria (MSC) can be applied to patients with LBBB/PPM. The criteria are:
- Concordant STE(> 1 mm) in any lead (any single lead)
- Concordant STD(> 1 mm) in V1~V3 (just one lead) → for PPM, extend it to V1~V6
- Excessive discordant in any lead(STE/S >0.25 or STD/R >0.3)
One thing to note here: stop using Criteria C of the Sgarbossa criteria (Discordant STE >5 mm) → its false-positive rate is high and it isn't specific, which is why Smith published the MSC in AEM in 2012 to replace Criteria C and fix this problem.
If you use 0.25 as the MSC cutoff, sensitivity gets to 80% and specificity to 99%. If you use 0.3, sensitivity may drop to 64%, and you'd actually miss a lot of AMIs.
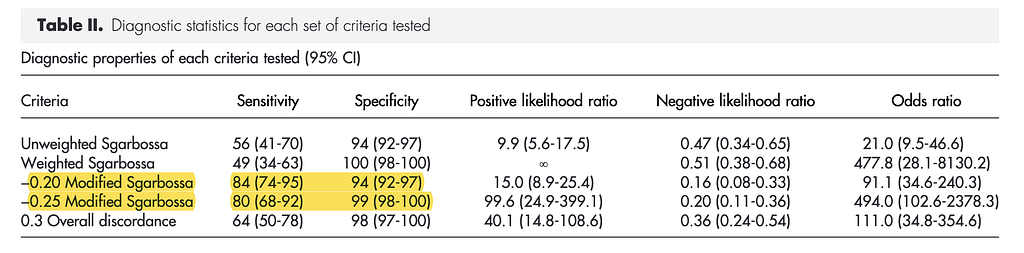
The figures (Fig.1 & 2) make it a bit clearer.
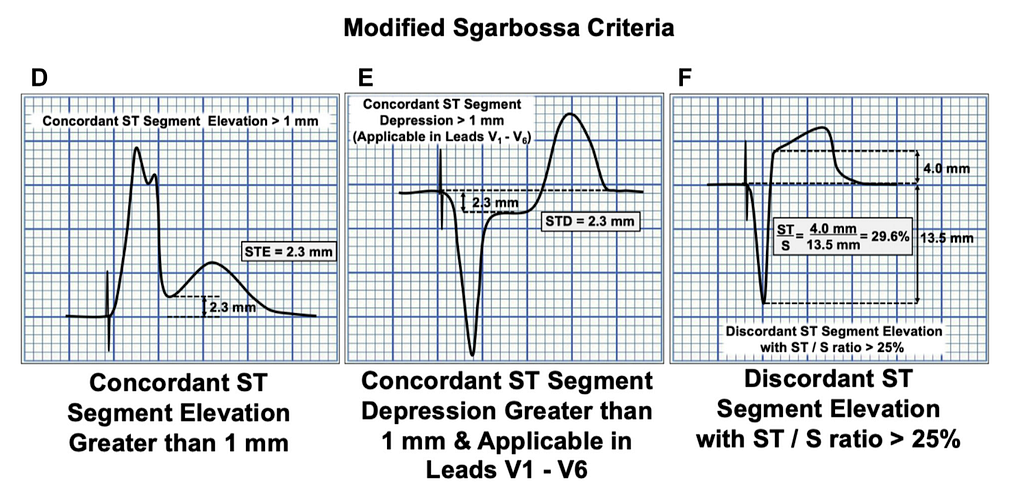

I've drifted off topic a bit
The main point of all that is: MSC Criteria C is important and can help us assess whether there's an OMI.
Let's look at a few more examples.

In this tracing you can see obvious hyperacute T waves in the VPCs. V2 also shows Concordant STE in the VPC. This is another case of spotting an ischemic change through the VPC.
In Stephen Smith's experience, OMI used to be diagnosed from the ST-T wave morphology of sinus-conducted beats. But over the past 10 years, Smith has found quite a few cases where OMI could be diagnosed from morphology changes in the VPCs.
Here's another one

Here too, Concordant STE is seen in the VPCs in V1~V3, while the sinus-conducted beats show no obvious STE (maybe Large T waves → comparing with a prior ECG would be more accurate).
Next, one of my own Cases:
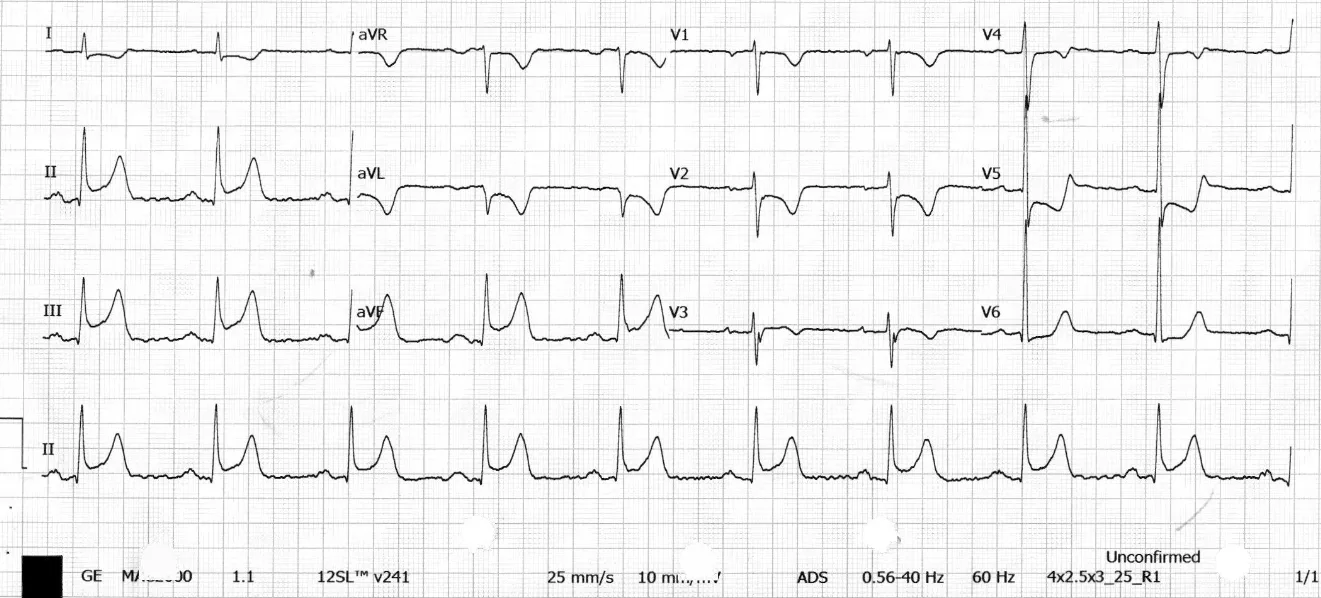
52-year-old man, chest pain with cold sweats starting in the afternoon (Fig.3)

Breaking this ECG down further: sinus tachycardia, about 120 bpm. In the long lead II you can see group beats in the red box. Setting the group beats aside, there's STE over V2~V4, leaning concave, with minimal STD in lead II and aVF.
In a 52-year-old man, 2 mm of STE in V2~V3 counts as STE. This Case has about 3 mm in V2 and about 2.5 mm in V3. That already meets STEMI criteria — you can Call CV man. On top of that, there's reciprocal STD change in the inf. leads (30~50% of Ant.wall STEMI patients won't have it).
If this much elevation still doesn't move you to Call CV man, let's run the Smith 4 variable formula for Subtle LAD occlusion.
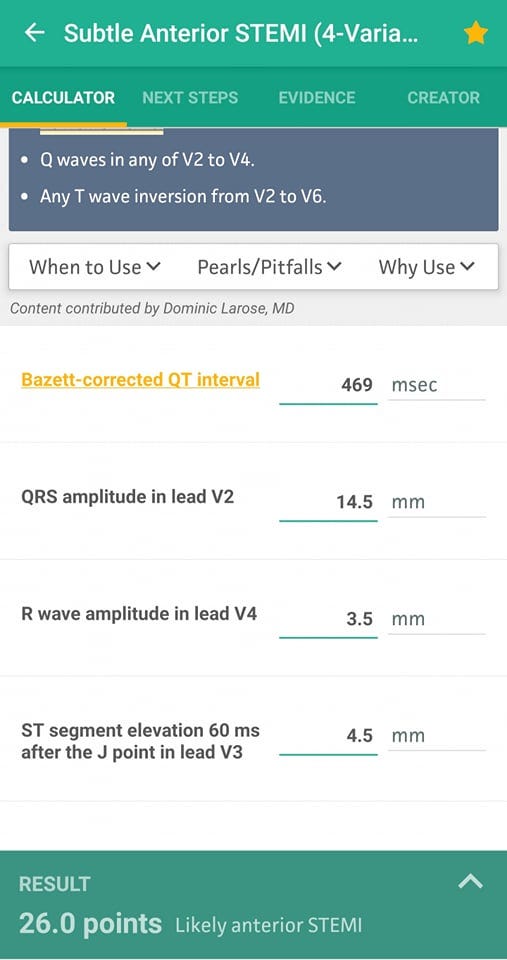
QTc:469
QRSV2:14.5
STEV360:4.5
RAV4:3.5
Result: 26 >18.2 → highly likely Ant.STEMI
(Of course, what this equation tells you is that this looks a lot like Ant.wall STEMI → you need to be highly alert. But whatever you do, don't just take this number to CV and say, look, it calculates to STEMI, we need to cath right away. Nobody's going to listen to you!!!!)
Ps: the Smith 4 variable formula has exclusion criteria. One of them is that there must be no reciprocal STD change. So actually the formula can't be used here. Why? Because reciprocal change means it's an obvious MI. So you don't need the formula — you can already call it an MI!
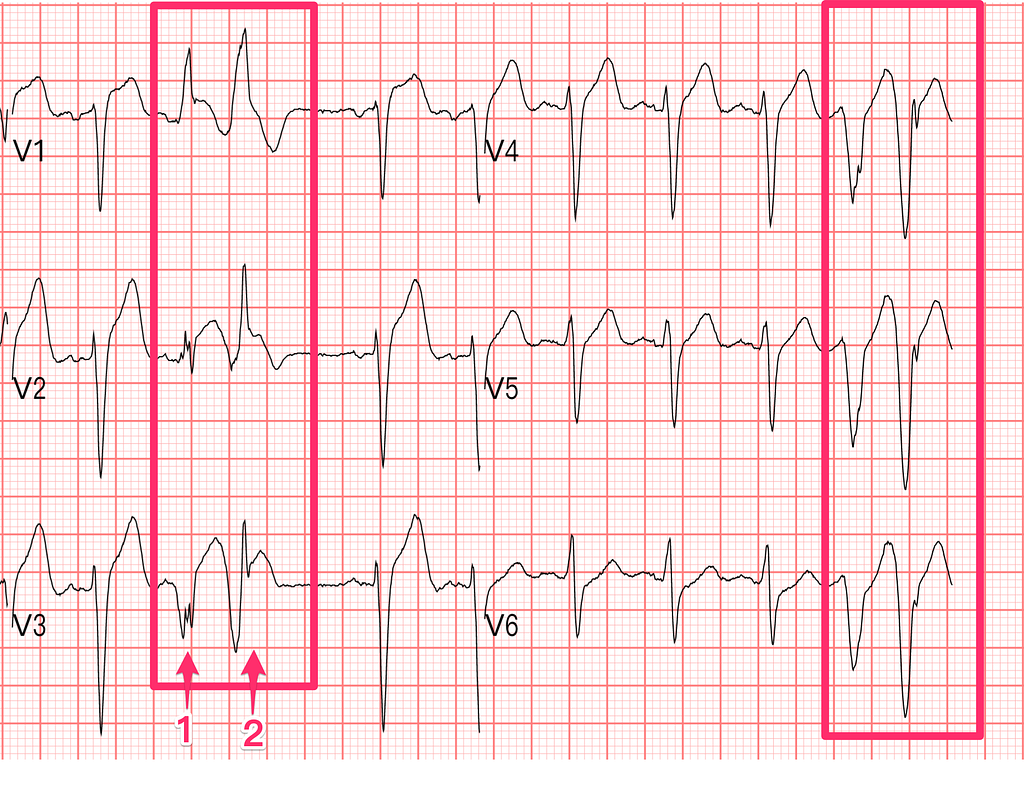
Say the STEMI criteria can't get you to Call CV man, and you don't know how to use the Smith 4 variable formula either. Then let's look at what's going on in these group beats.
The first beat of the group beats seems to have a P wave (trace it over to V1~V2) and leans toward an RBBB pattern. The second beat looks wide with no obvious P wave, probably a VPC beat, and V2~V3 show obvious concordant STE — concordant STE that appears because there's ischemia. This is evidence of OMI too.
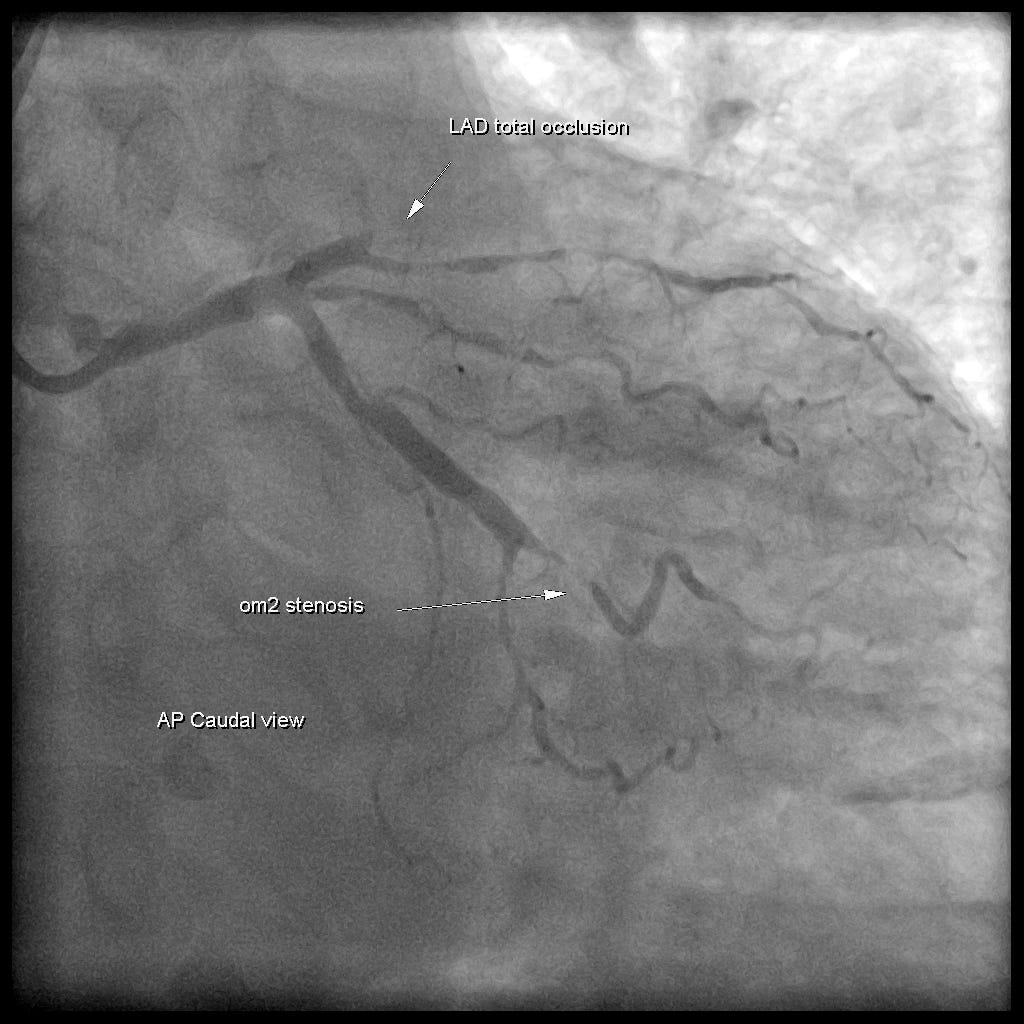
The patient underwent PCI, which showed LAD total occlusion.
This Smith ECG post makes these points2:
- In LBBB, PPM, or LBBB-like QRS complexes (such as VPCs) (not yet studied), the MSC should be used to look for ACS (currently only LBBB/PPM have a Validation study)
- The principle of Appropriate discordance can be applied to all wide QRS complexes → when wide QRS complexes are present and you suspect ACS, look for excessive discordance (i.e., meeting MSC criteria C)
Next, let's look at one where a VPC can warn you that a fatal arrhythmia may be coming.

The ECG above shows a bigeminy pattern. But note: look at the QT interval of the VPC beats — about 560 ms

Fig.5 is the QT interval nomogram3. At H.R<60, any QT interval > 485 ms carries a risk of TdP; at H.R>60, as H.R rises, the QT interval at which TdP risk appears falls accordingly. In other words, above the line, watch out for TdP.
So a QT interval of 560 ms really means TdP is very likely coming next. So check quickly for Hypo-K and Hypo-Mg, and whether the patient is on any QT-prolonging drugs. Get the patient on a monitor right away and keep them right in front of you — don't wait for a nurse to rush over and tell you that bed so-and-so in the observation area looks kind of off (by then a fatal arrhythmia has already started).
To sum up the key points of this Blog post:
- If a VPC shows concordant STE or excessive discordant STE (STE/S>0.25) or Hyperacute T waves, it can help diagnose OMI
- If VPCs come with QT prolong, correct the cause quickly to head off a subsequent lethal arrhythmia
Dr. Smith’s ECG Blog: Hyperacute T-waves and Concordant ST Elevation seen in PVCs only — link ↩︎ ↩︎
Dr. Smith’s ECG Blog: An elderly man who dies 12 hours later — could he have been saved? — link ↩︎ ↩︎
Chan, A., Isbister, G. K., Kirkpatrick, C. M. J., & Dufful, S. B. (2007). Drug-induced QT prolongation and torsades de pointes: evaluation of a QT nomogram. __QJM: Monthly Journal of the Association of Physicians__, __100__(10), 609–615. https://doi.org/10.1093/qjmed/hcm072 ↩︎ ↩︎
Thoughts on this case? Leave a comment, a like, or a reaction below.
comments powered by Disqus