Translated from the original Traditional Chinese post. Read the Chinese original →
This is Part 2. Part 1 is here. That post worked out three things that run against intuition: the number of board-certified emergency physicians who actually left the ED is not as large as the media claimed (72, not 139); ED patient volume has not particularly grown either: total visits still haven't returned to pre-pandemic levels today, and what changed is the mix inside; and it's not that everyone rushes to the ED with every little ailment: looking at the five-level triage as a whole, the share of low-acuity patients hasn't gone up, and has actually dipped slightly.
Where Part 1 left off
Let me first settle the accounts from Part 1.
On the people side: training isn't the problem. Every year there's a steady stream of roughly a hundred newly board-certified emergency physicians. But starting in 2024, the rate of people transferring out of emergency medicine doubled (1.75% → 3.55%), and it didn't come back down in 2025. For every 10 new people coming in, 7 who were already practicing in the ED transfer out. By 2025, 1 out of every 4.5 board-certified emergency physicians was no longer practicing in an ED, and 80% of them ended up in non-hospital settings like clinics, aesthetic medicine, and health-checkup centers.
On the patient side: total ED visits actually haven't returned to pre-pandemic levels; 2025 was still 1.4% below 2019. All of the extra patients are elderly (age 65 and older, +15.7% over five years)1, and that is purely driven by population structure; visit rates within each older age group are actually falling. The low-acuity share is falling too, and a NT$300 increase in the copayment didn't drive people away either.
So "more patients" and "public abuse," the two most intuitive explanations, have both been shown by the data to be wrong. That leaves only one question:
Can these patients actually get admitted in the end?
This is actually the most central problem in ED crowding. An ED is by nature a way station; its design premise is to treat patients and then send them on, either home or up to a ward. Once patients can't be sent on, they pile up. And the number an emergency physician is really bearing is how many people are lying here right now. How many came in over the whole day is, oddly, not what matters most.
The question families ask me most is: "When can we go up? How much longer until there's a ward bed?" Every time, I really want to just tell them: in this hospital, the person who most wants you to go upstairs quickly is the emergency physician. It's not impatience. It's that for every minute you stay here, I have to keep one eye on you and the other on the door, where the next person is going to walk in. But that bed isn't in my hands. The decision about when a bed opens up has never been made in the ED.
The NHIA (Taiwan's National Health Insurance Administration) happens to have an indicator that measures exactly this, called the rate of ED-to-admission cases boarding in the ED over forty-eight hours2. Its denominator is the number of ED cases transferred to inpatient admission, and its numerator is those among them who stayed in the ED more than 48 hours. In other words, it's the proportion of patients who are already confirmed for admission but are still stuck in the ED.
Source: Definition of indicator 1652 on the NHI Medical Quality Information Disclosure website, National Health Insurance Administration, Ministry of Health and Welfare (MOHW).
Nationally: 5.3% in 2024, 5.88% in 2025. That's a relative worsening of nearly 11% in a single year3.
And medical centers are on another scale entirely. NTUH (National Taiwan University Hospital) was 22.18% in 2024 and 23.83% in 2025, and in quarter 3 of 2025 it reached 25.94%. Of every 4 ED patients confirmed for admission, more than 1 stayed in the ED two full days or longer, four times the national average. Nor is this a new problem: from 2014 to 2020 it exceeded 24% for seven straight years, and in 2015 it hit 27.49%3.
Source: NHIA Medical Quality Information Disclosure website, indicator 1652; as cited in an ETtoday Health Cloud report, August 26, 2026.
Two other indicators point in exactly the same direction4:
- The rate of patients kept in the ED over 24 hours (denominator: all ED cases): 3.32% in 2023 → 3.68% in 2024 → 3.75% in quarter 1 of 2025. Before the pandemic this number was roughly in the 2.32%–2.75% range5, so that's a full percentage point more
- The rate of triage level one, two, and three patients transferred to a ward within 8 hours (denominator: cases in these three levels that were ultimately admitted): 61.90% in 2022 → 60.60% in 2023 → 59.50% in 2024 → 56.29% in quarter 1 of 2025, four straight years of decline
Source: National Audit Office, *A Preliminary Review of the Effectiveness of Tiered Care, Health Workforce Retention, and ED Crowding Mitigation in Recent Years* (fiscal year 2025 [ROC 114], citing the NHIA DA system).
The most glaring is triage level one, the most critical group, the ones who most need to go straight up to a ward. Among level-one patients who were ultimately admitted, the rate of getting transferred within 8 hours was 62.58% in 2023, 61.25% in 2024, and down to 54.89% in quarter 1 of 2025; looking at medical centers alone, it's only 39.33%4. In other words, at medical centers, out of every ten level-one patients who will eventually be admitted, six are still lying in the ED after 8 hours. The minutes of the National Health Insurance Committee also recorded this: in the first half of 2024, the ED boarding time for critically ill patients at medical centers and regional hospitals was nearly 1 hour longer than in the second half of 20236.
Source: National Audit Office, *A Preliminary Review of the Effectiveness of Tiered Care, Health Workforce Retention, and ED Crowding Mitigation in Recent Years* (fiscal year 2025 [ROC 114], citing the NHIA DA system).
This is where the whole thing finally clicks together. Put the four questions side by side:
Source: The preceding sections of this post; see the footnotes in each section for data sources.
In other words, what crushes emergency physicians is the number of patients piled up in the ED at the same moment. How many came in over a whole year is a different matter. Yet the ED service-volume statistics and the staffing formulas all recognize flow: visit counts, visit rates, copayments. It's not that boarding indicators don't exist; the ones above all are. The problem is that not a single one of them makes it into a staffing formula. That's why, while things are visibly falling apart on the floor, the reports look fine, and can even be written up as showing early signs of improvement.
The one extra staff member I feel on my own schedule is exactly what this stock eats up. That extra attending spends the whole shift taking care of the people who should have gone upstairs yesterday or the day before and are still lying in the hallway now. And if you stack three numbers on top of each other, you can see how the pressure gets amplified layer by layer. Counting from 2019 to now in each case: ED visits by people 65 and older are up 15.7%; the national rate of ED patients staying over 24 hours went from 2.32%–2.75% before the pandemic5 to 3.75%, an increase of roughly 36% to 62%; and on my own shifts, the number of patients at handoff who are waiting for a bed or still have no disposition went from 5–7 to 10–15, doubling.
At this point in writing, I ran a calculation whose result I didn't see coming myself.
I took the number of board-certified emergency physicians in each NHI region, published annually by the Taiwan Society of Emergency Medicine (TSEM), as the denominator, and the hospital ED visits per region from the MOHW county/city statistical tables as the numerator, and calculated annual ED visits per board-certified emergency physician, that is, on paper, how many patients one emergency physician has to handle in a year78910.
| Region | 2023 | 2024 | 2025 | Change |
|---|---|---|---|---|
| Taipei | 4,111 | 3,870 | 3,742 | −9.0% |
| Northern | 6,020 | 5,793 | 5,614 | −6.7% |
| Central | 4,432 | 4,207 | 4,269 | −3.7% |
| Southern | 4,191 | 3,981 | 3,882 | −7.4% |
| Kaoping | 5,514 | 5,277 | 5,093 | −7.6% |
| Eastern | 4,672 | 4,183 | 4,128 | −11.6% |
| National | 4,660 | 4,421 | 4,329 | −7.1% |
The on-paper load per emergency physician fell 7% over these three years. All six regions, without exception.
If you were the regulator looking at this table, what conclusion would you draw? ED staffing is improving. Visits slightly down, physicians up, load per person falling year after year; you could even write it up as a report showing early results.
And yet on the shift I work, there's one more person, and everyone is more tired.
It's not an illusion, and the table isn't miscalculated. The problem is that this formula itself can't measure the real load. Its numerator is how many people came in a year, but that's not what's crushing the ED. There are at least three things it can't measure:
- Who the patients are. ED visits by people 65 and older rose 15.7% in five years, and in my experience an elderly patient with multiple comorbidities takes 3 to 5 times as long to manage as a young healthy one. Both get recorded as "one visit," weighted equally in the formula, yet on the floor they differ several-fold
- Whether patients can leave. The moment the day shift takes over, there are already a dozen-plus people on hand who've been decided for admission but still have no bed. They were already counted once in last year's statistics; this year they're still lying here, but the formula won't count them again
- Who's beside you helping. The denominator counts only board-certified emergency physicians, not residents. And the fill rate for emergency medicine residency, which filled every year before the pandemic, fell short for the first time in 2021 (92%), then dropped to 65% and 67%, and only got back to 80% in 202411. At our hospital, for example, the resident slots just sat there unfilled for three or four years. Over those three or four years only one attending left, so the attending headcount is about the same; but the few missing residents mean overall physician staffing has had a net loss. That loss doesn't show up on that table at all
And what's most unsettling: this kind of formula is exactly what the government uses to assess ED staffing. And it's written in black and white in the regulations. Under the MOHW's annually announced Hospital Emergency Medical Capability Classification Criteria, the number of full-time emergency physicians an advanced-level hospital must have is calculated like this: a floor of 5, then once the average annual ED visits over the prior three years exceed 20,000, add 1 for every additional 5,000 visits, plus a share equal to average monthly observation-stay visits divided by 600; for intermediate-level hospitals it's even simpler: average annual ED visits divided by 5,00012.
許建清, then president of the Taiwan Society of Emergency Medicine, put it very bluntly: the current method of assessing emergency medical staffing estimates ED staffing from patient volume and the number of observation beds, without taking into account features like the extreme time pressure in the ED and the fact that the number of patients waiting for beds easily exceeds the number of observation beds, which leads to staffing being severely underestimated11.
Of the two variables in the formula, one is how many people came in a year and the other is how many patient-days of observation beds were used; both are flow. A patient who lay in the ED for three days still counts only once in the visit term. The observation term does catch that patient, though: NHI billing for ED observation beds only looks at whether the patient was under observation or waiting for a bed and stayed a full six hours, and doesn't require the patient to be lying in a registered bed13.
What really gets missed is the hallway itself.
The same criteria also specify how ED nursing staffing is calculated, and it's two terms added together. The first term counts flow: 1 nurse for every 12 ED visits per day on average. The second counts stock: where ED observation beds are provided, 1 shall be added per bed12. New arrivals and patients lying there unable to leave each get their own share of staffing on paper.
That "1" refers to positions summed across all three shifts of the day, not a nurse standing beside every bed at all times. The Standards for Establishment of Medical Care Institutions has a whole set of coefficients written the same way: 1.5 per bed in the ICU, 1 per three to four acute general beds, 1 per bed in the ED observation room14. So one observation bed equals one position. And the positions are split across the day, evening, and night shifts, so only a third are on duty at the same time; converted, on paper one nurse covers three beds.
Let's run the numbers once at the scale of our ED: around one hundred sixty visits a day on average, twenty-four registered observation beds15. The flow term is 160 divided by 12, about 13 people; the stock term is 24 beds times 1, 24 people. Add the two terms: 37.
These 37 are the establishment, meaning the total number of nurses this ED should have on its personnel roster. It's not the number used up in a day, nor the number standing on one shift. Split across three shifts, on paper it's 12 per shift.
The problem is how a "bed" is defined. The criteria are rigid about it: the number of beds registered with the local health bureau as of the first of each month is what counts12.
The observation beds our hospital actually registers are Zone A, Zone B, the exam rooms, and the resuscitation room. Those places added together make up the number reported to the health bureau each month, and they're the only beds that get counted in the formula.
But a real ED doesn't work that way. When we can't fit people in, we grow a batch of spots of our own, and every one of them has a name:
Room One front, Room One back, Room Two front, Room Two back, Room Three front, Room Three back, Room Five front, Room Five back, Hallway front, In front of Big Sis's computer, In front of the referral computer, the 119 Hallway, Beside Triage One, Beside Triage Two, Beside Triage Three.
I read them out one by one because this string of names says it all. Not one of these spots was planned; their only shared logic is this: there happened to be space there, so a patient was put there. The person lying beside triage still needs blood drawn, still needs injections, still needs vital signs watched, still presses the call button in the middle of the night; but the spot that patient is lying in isn't on the registration form, so in the formula that calculates staffing, the bed they occupy counts as zero.
We have our own name for these beds: ghost beds. They're right there, with people lying on them, but you can search every form and never find them.
The extra patients are real; the extra beds don't count.
And the people looking after them are the same crew. When those 12 are on shift, they don't have only the 24 registered beds on their hands; there's that whole row of ghost beds too, plus the fifty-odd patients who walk in new during that shift. The people lying in the hallway don't generate half a staff member for anyone, yet they all fall within the responsibility of the same shift's nurses. On paper one person covers three beds; how many they actually cover depends on how many are lying in the hallway that day.
Bed counts and staffing coefficients are calculated per the Hospital Emergency Medical Capability Classification Criteria (2026 [ROC 115] edition) and the Standards for Establishment of Medical Care Institutions, Appended Table I; bed names and floor layout are the author's first-hand experience at the author's own hospital.
And that registered number is extremely sticky. Under the Standards for Establishment of Medical Care Institutions, ED observation beds are "special beds": how many you open must be registered with the health bureau, adding beds means going through an amendment of registration, and you have to add the nursing staff at the same time14. So it almost never moves. I went through the MOHW hospital bed statistics: the registered ED observation beds in Yilan City were 24 beds for five straight years from 2021 to 2025, not a single bed changed15. Over the same period, the national rate of patients kept in the ED over 24 hours rose from 2.32%–2.75% before the pandemic to 3.75%5.
The beds didn't increase; the people in the hallway did. The difference between the two is that string of names above.
So how often does this happen? There's a number that can answer that.
By law, emergency responsibility hospitals must upload four items of real-time ED information every thirty minutes, and the first item is reported full capacity to 119 (Taiwan's EMS dispatch number)16. This is public: the NHIA posts it on its Real-time ED Information for Advanced-Level Emergency Responsibility Hospitals page, and anyone can look it up.
Let me be clear about one thing first to avoid misunderstanding: reporting full capacity doesn't mean closing the doors. Walk-in patients are still accepted, and ambulances that should bring patients here still do. It's a signal to the dispatch center, so that while there's still a choice, the next ambulance gives priority to somewhere else. The door isn't closed; there's just no room left inside. Starting in mid-June 2026, I recorded our hospital's reporting status hour by hour, and by early September 2026 I had accumulated 1,659 records17.
⚠️ This number is only suitable for looking at change over time within the same hospital. Among the 59 facilities listed in that system, full-capacity rates are bimodal (median only 0.1%, while several sit near 100% long-term), showing that reporting habits vary enormously between hospitals; comparing across hospitals is meaningless. (59 is the number of reporting facilities listed by that query service, which differs from the number of advanced-level emergency responsibility hospitals designated by the MOHW.)
The second half of June 2026 was 38.7%, July 45.4%, August 55.9%, and the first five days of September 77.1%. Of the thirty-one days in August 2026, twenty-five had full capacity at some point; from ten a.m. on August 23 to seven a.m. on August 27, across those ninety-three hours, every single record I captured showed full.
And what does "full" mean on the floor?
It means those twenty-four registered beds are all occupied. And once the beds are full, anyone who comes in after that can only go to the unregistered spots. So the words "reported full" are simultaneously telling you: the ghost beds in front of Room One, behind Room Five, in the 119 Hallway have definitely been opened up. At our hospital, reporting full capacity means something very direct: the registered beds are all full; and once we're full, any further patients who come in needing to lie down can only go to ghost beds. When we're not full, those spots may not get used.
That's what "full" really means. ED visits are fixed, the registered observation beds are fixed, and the twelve nurses per shift that the regulations calculate are fixed too. Only one thing really varies: how many beds these twelve people have to look after today. When we're not full, it's within twenty-four, still within what the regulations envision; when we're full, it's twenty-four plus the hallway, and those bed spaces that exist on no form are split among the same crew.
Nobody got laid off and nobody quit, but during those hours the nursing care each patient could get really did shrink. The reason is simple: the denominator got bigger. The same twelve people who were covering twenty-four beds now have to cover twenty-four plus that whole row of ghost beds. And precisely because those beds don't exist on paper, the share that's been diluted away doesn't show up in any report either.
So the full-capacity rate can serve as a proxy for exactly this: in a month, how much of the time our staffing was actually not enough. For August 2026 the answer is more than half; for September 2026 so far, it's three-quarters.
Laying out those ninety-three hours makes it a bit clearer. Every point in the chart below comes from that NHIA public query system: no login, no in-hospital access of any kind; you can open it right now and look it up.
The green dashed line is the number of ED observation beds registered in that administrative district; the line graph is the NHIA's publicly posted number waiting for admission.
Of those one hundred twenty records over five days, sixty-four had more than twenty-four people waiting for admission. The ones over the line didn't vanish; they were lying in front of Room One, behind Room Five, along the hallway. The highest was at eight a.m. on August 24: thirty-nine people waiting to go upstairs, while the registered observation beds numbered twenty-four.
The criteria themselves know this will happen. The next point in the same article states that when the number of ED observation patients exceeds the number of registered ED observation beds, there shall be a hospital-wide mechanism for mobilizing medical and nursing staff for support12. The regulations acknowledge that this will happen, and then hand it to the hospital to figure out on its own.
There's one more layer. The point that calculates nursing staffing is marked in the criteria with a "trial" label, meaning it's a trial assessment item whose results aren't counted toward the grading score; while the next point, the one requiring a mobilization mechanism, is formally scored12. How many people you should staff doesn't count for points; how you get through it on your own does.
So you get a picture like this: on one side, the on-paper load per person is down 7% and the low-acuity share is down, which written up as a report means early results; on the other side, the day shift is still exhausted even with one extra person scheduled, patients are lying in the hallway waiting three days, and a residency slot goes unfilled for three years.
Both sides are telling the truth. The only difference is that the official set of indicators measures flow, while the ED's real pain comes from stock.
Back to the question I first asked myself: is the ED broken, or just too busy?
Too busy is a flow problem; you get through it and it's fine. Broken is a structural problem: the fire coming in keeps burning hotter (population aging), the exit is blocked (wards can't open beds), and the people tending the furnace are leaving one by one, with no new ones coming. If any one of these three happened on its own, the ED could hold up. Stacked together, you get what we have now.
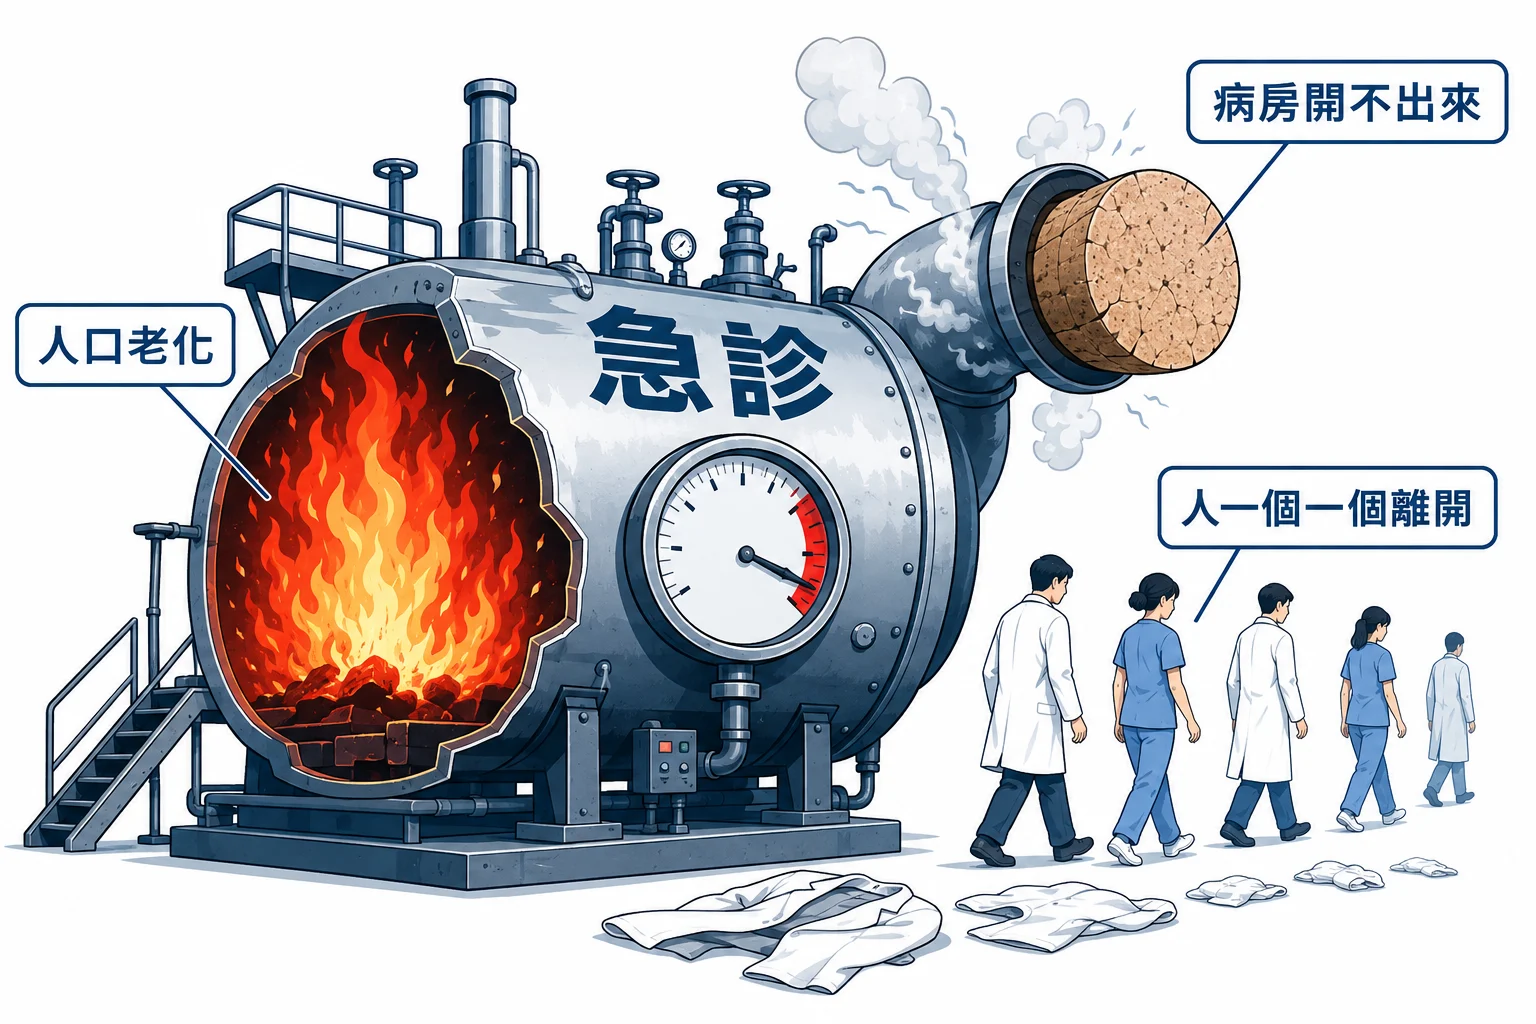
Conceptual illustration, not a statistical chart.
This amplification chain is how ED crowding really works. The demand side actually moved only a little: elderly ED visits rose 15.7% over five years, which sounds entirely within a manageable range. But these patients need admission more than before, and the wards can't open beds because of the nursing shortage, so they get stuck in the ED. The stuck patients pile up, and the rate of stays over 24 hours worsens by 36% to 62%; by the time it shows up in the hallway of a single ED, it has become a doubling.
Sources: MOHW Department of Statistics, ED Visit Statistics; 韓幸紋 (2025), citing the MOHW *Handbook of Reference Indicators for Global Budget Negotiation*; the last item is the author's own first-hand experience.
An input that grew 15.7%, passing through a system with a blocked exit, ends up as a doubled load on the floor. That's why, from where the regulators sit, the numbers all look okay; but the people standing inside the ED will tell you these past few years have been completely different. Neither side is lying; they're just standing at different ends of this amplification chain.
So why did the pay raises only start in the last year and a half?
This was the part I originally couldn't figure out. The bleeding doubled back in 2024, yet the wave of raises only became obvious in the second half of 2025. There's a gap of almost a year in between.
The answer is actually very practical: the money only arrived in May 202511. One thing to be clear about: what I'm talking about here is money going into the NHI and into hospitals; how much of it actually turned into paychecks for frontline ED doctors and nurses, nobody has tallied, and I can't tell you either.
| When | Policy | Amount |
|---|---|---|
| May 2025 | NHI's four major measures to relieve ED crowding (ED observation-bed nursing fee raised 60%, a new consultation fee, higher ICU payments) | NT$4.24 billion/year |
| 2025 | Public-hospital medical staff raises of 7–11% (Tier 1 professionals 7.5%, Tier 2 7.8%, Tier 3 11.5%); NHI point value guaranteed at 0.95 or above | Hospital-wide / NHI-wide, not earmarked for EDs18 |
| November 2025 | UCC (holiday urgent care center) pilot | NT$300 million19 |
| 2026 Lunar New Year | Incentive to keep clinics open, 100% bonus from New Year's Eve through the third day | Initial estimate NT$1.36 billion, final NT$1.6 billion20 |
It wasn't until 2025 that hospitals had both conditions at once: they had no choice but to raise pay, and they had the money to raise pay. Before that, even if management knew people were leaving, they couldn't squeeze out the money from the books to keep them.
So the pay-raise wave of this past year and a half is, at its core, a delayed reaction colliding with new money entering the scene. Raises don't mean things have gotten better; they only mean things have gotten bad enough that a budget is willing to come in.
The government reset the market rate itself
This point is rarely discussed, but I think it has the most direct effect on pay.
The UCC that launched in November 2025 offers primary-care doctors this rate: one 8-hour shift, NT$15,000 for a day shift, NT$20,000 for a night shift2119. That works out to NT$1,875 and NT$2,500 an hour.
Compare that with full-time hospital emergency physicians. According to the physicians' union, the going rate in Taipei is NT$22,000 to 25,000 for a 12-hour shift, an hourly rate of roughly NT$1,833 to 2,08322.
The government's price matches full-time hospital pay per hour, its ceiling is 20% higher, and the work is easier. UCC only takes triage levels four and five.
To put it bluntly, this is the government itself stepping in to bid. If hospitals want to keep people, on paper they have to chase this price. The union warned about it directly at the time: this would in effect encourage emergency physicians to flow toward primary care, and however much money is poured into UCC, the same resources should go into improving the existing critical-care environment23.
A bidding war with no new supply
Put all of the above together and it explains the phenomenon you and I have both felt: why "every" hospital is raising pay, and "every" hospital is still looking for people.
Because the number of people practicing emergency medicine nationwide grows by a net of only 47 a year. Part 1 worked out the accounts: the number registered as practicing in emergency medicine went from 1,693 to 1,740, with 102 newly board-certified emergency physicians coming in, 70 transferring out, and 13 transferring in from other specialties9.
With the total barely moving, when Hospital A poaches one person with a raise, Hospital B is one person down. Raises don't create new emergency physicians; they just redistribute the same 1,740 people. And as soon as one hospital starts raising its price, the others have no choice but to follow, or they lose.
This is a bidding war, not a market expansion. The money keeps stacking up; the people are always the same people.
What hospitals are actually doing confirms this. All three of these examples come from a November 2025 report by Business Today reporter 馬揚異22. Taichung's 長安醫院 originally had 8 full-time emergency physicians; after 1 left, each of the rest had to work 2 to 3 more shifts a month, 20 to 30 more hours; the hospital's solution was to bring back recently retired old comrades part-time. Chi Mei has 3 contracted emergency physicians, each covering 2 to 4 shifts a month. The NTUH superintendent, 余忠仁, also admitted they were planning to hire "returning physicians," using their non-clinic time to bring them back onto the schedule.
Far Eastern Memorial Hospital's approach best shows the nature of the problem. Its superintendent, 邱冠明, said plainly that they spent some time and held several meetings to change the ED pay structure and de-emphasize seniority, making the work environment friendlier24. De-emphasizing seniority means lowering the weight of years of service in pay, so the people actually working shifts get paid more. It's a very clear signal: pay has started tilting toward the people willing to work shifts, not toward the senior people. Because what's truly scarce now is the person willing to put their name on the schedule.
Why raises can't stop the bleeding
My judgment is that this round of raises can slow the loss, but can't hold back the trend. Three reasons:
First, the bottleneck isn't the emergency physicians. Raising emergency physicians' pay doesn't create hospital beds. As long as nursing staff keeps falling and wards keep closing beds, patients will keep piling up in the ED, and working conditions won't improve. The case that broke at NTUH in August 2026, of a patient who died after waiting 12 days in the ED for a bed, and reports of someone waiting 35 days for a bed, is the end-stage manifestation of this chain25. Whether ward beds can be opened has never been the ED's call; but the consequences of not opening them are borne entirely by the ED.
Second, the raises are competing against a rival with a completely different profit model. Hospitals live on the NHI; clinics live on self-pay. 蔡光超, director of the Department of Emergency Medicine at Far Eastern Memorial Hospital, put it bluntly in The Reporter: a hospital relying solely on NHI income is bound to lose money, so how can there be an insurance system under which hospitals can't survive?26 As long as that price gap exists, raises can only narrow the difference, not reverse the direction. And what clinics offer isn't only money. No night shifts, weekends with your kids: raises can't buy those back.
Third, money going into hospitals doesn't necessarily become pay. This point often gets skipped. The NHI gives hospitals the whole package, and how it's distributed is the hospital's decision. After payments were raised in May 2025, the Taipei City Physicians' Union issued a statement right after the Dragon Boat Festival holiday warning that, as of early June, the vicious cycle of staff loss, ward closures, and ED crowding had not improved, and that they had not heard of any hospital raising staff pay as a result11. Between the money leaving the NHI and the paychecks on the front line, there's a whole layer of the hospital's own allocation decisions, and no regulation reaches that stretch.
That's also why a policy direction that emerged at the end of 2025 is worth watching: the MOHW is proposing to amend the NHI contracting and management regulations so that starting pay for new medical and nursing staff can't be just the minimum wage, but must be a multiple of the minimum wage27.
To see the weight of this, you have to put it back into how the NHI pays. The NHI pays one big package: higher ED consultation fees, higher observation-bed nursing fees, higher ICU payments, with the money going to the hospital; and how much of that package becomes doctors' pay, how much becomes nurses' pay, how much goes to cover other departments' losses, how much just stays on the books, is all up to the hospital. That's how you end up with payments raised in May 2025 and the union saying in June that it hadn't heard of any hospital raising pay as a result: the money really was paid out, there's just no rule that says it has to reach anyone in particular.
Writing starting pay into the rules touches a different place. It doesn't hand over an extra sum of money; instead, it writes directly into the conditions for a hospital to receive NHI money: the pay you give new hires can't be below a certain number; and if you can't meet it, your contract is affected. That's the whole difference between giving the money to the hospital and letting the hospital divide it, and ruling on how the hospital divides it: the former can only hope the hospital is willing to pass it down; the latter makes the distribution outcome itself the threshold for getting the money. That is the cut that actually touches the structure.
Finally
Back to the very first question: are there really too few people? Are too many really leaving? Or are too few staying?
The answer the data gives is the third one.
The number of people hasn't shrunk; board-certified emergency physicians practicing in EDs are still slowly increasing. The absolute number leaving isn't outrageous either, 70 a year. But those 70 cancel out 70% of that year's new blood; and of the 2,240 practicing board-certified emergency physicians, one-third are already 50 or older, and the middle generation that can carry high-intensity shift rotations is thinning9.
And the demand side doesn't wait for anyone. Total ED visits actually haven't increased; 2025 was even a bit lower than 2019. But ED visits by people 65 and older rose 15.7% over five years, with their share climbing from 29% to 33%1. Break it down and that 15.7% is entirely pushed up by population structure (population +24.8%); the proportion of elderly people going to the ED and how often they go are actually both falling. At the same time, the low-acuity share (triage levels four and five) is falling too, and after the ED copayment at medical centers went up NT$300, the case count actually rose instead of falling. The room that could be squeezed out on the side of public behavior has pretty much already been squeezed out; the remaining pressure comes from population structure itself, and that isn't going to reverse.
So the people who stay can only keep adding shifts every month. 羅祥雲, chief of the Department of Emergency Medicine at Linkou Chang Gung Memorial Hospital, said in an interview that the hospital's emergency physicians originally worked 15 to 18 shifts a month; before new attendings arrived in August 2024, everyone basically had to start at 20 shifts, with the younger ones scheduled for as many as 23, meaning 23 days a month in the ED26.
To feel this number, you have to convert it into days. The baseline in emergency medicine now is roughly 15 shifts a month, 180 hours, 12 hours a shift. Starting at 20 shifts means standing five to eight extra 12-hour shifts every month; 23 shifts means 23 days a month you're physically in the ED. I've worked that kind of schedule myself. In my residency years, I was scheduled for 23 or 24 shifts a month, 12 hours each. I don't have any real memories from that stretch; all I remember is getting home after a shift and just wanting to collapse into sleep, not wanting to do anything. I could hold out back then because I knew it was training, and it would end. Ask an attending to live like that every month, with no end in sight, and I think I'd blow up.
Raises deal with whether to stay, but not with what life looks like if you stay. When a person works 23 shifts a month, no amount of money does anything more than hold them in place until they leave later.
I don't think this round of raises is a bad thing; the money is finally willing to come in. But if over the next year the resources are still all bet on price, rather than on opening up ward beds, guaranteeing ED nursing staff, and getting the observation patients upstairs, then around this time next year we'll probably see exactly the same news, just with uglier numbers.
While writing this, if someone asked me: was there one time that made you feel emergency care had collapsed? Which time was it?
I thought about it, and I probably couldn't answer.
Not because there wasn't one. Because there were too many, so many that I can't pick out a particular day.
Only later did I realize that this sentence is actually the answer to this whole post.
I remember SARS. I remember the COVID waves too: which year, which month, which day the patients started flooding in, and when it eased off. Those were events. Events have a beginning and an end, so they get remembered, and that's also why you can get through them.
But this, now, I can't recall which time it was. Because it isn't an event; it's the background. It's no longer one especially terrible shift; it's every shift.
Too busy leaves memories. Broken doesn't. Broken things slowly become what you're used to.
So back to the question at the very beginning: is the ED broken, or just too busy?
My answer is the former. And what I think is most dangerous is this: when something gets so broken that even the people inside can't point to the day it started, it usually means it's been broken for a long time.
References
The ED visit figures cited in this post come from two separate official statistics with different coverage; their absolute values can't be divided across each other. "Total visits" come from hospital ED visits in Table 11 of the MOHW Department of Statistics' Annual Statistics of Medical Care Services of Medical Institutions: 7.64 million in 2019, 7.48 million in 2024, 7.53 million in 2025. "Visits and share by age" come from the Department of Statistics' government open data, ED Visit Statistics by Sex and Age, whose population base is larger: 12,352,512 visits in total in 2019, of which 3,593,511 were age 65 and older (29.09%); 12,545,504 in total in 2024, of which 4,156,451 were age 65 and older (33.13%). The +15.7% and 29%→33% in this post are both calculated within the latter. The two statistics agree on whether total ED volume increased: between 2019 and 2024, the former changed −2.1% and the latter +1.6%, both within ±2%. (Additional note: this open data includes a "disease category" field; one visit can map to multiple disease categories, and the sum across categories is about 1.95 times the total, so only rows where "disease category = total" can be used for total volume.) https://dep.mohw.gov.tw/DOS/cp-6600-74522-113.html ↩︎ ↩︎
National Health Insurance Administration (NHIA), MOHW, NHI Medical Quality Information Disclosure website, indicator 1652, [Rate of ED-to-admission cases boarding in the ED over forty-eight hours] (in Chinese). https://med.nhi.gov.tw/ihqe0000/pepH1652.html?ind=1652&type=2 The site publishes each facility's indicator values by quarter (queryable range: the first quarter of 2010 [ROC 099] through the fourth quarter of 2025 [ROC 114]); query page: https://med.nhi.gov.tw/ihqe0000/pepC_Search001.html?ind=1652&type=2. Taking the fourth quarter of 2025 (ROC 114) as an example, the NTUH main campus was 22.76% (numerator 1,169 / denominator 5,137), and the Taipei Division it belongs to was 6.56%. The annual figures cited in the text are taken from the report in note 2 (which cites NHIA data); readers can also check them quarter by quarter on the query page above. ↩︎
ETtoday Health Cloud, [NTUH ED: '1 in Every 4' Wait Over 2 Days for a Bed; Doctor Laments: How Can None of the Nearby Hospitals Have the Capacity to Take Them] (in Chinese), reporter 邱俊吉, August 26, 2026. https://health.ettoday.net/news/3226084 Original text, translated from Chinese: according to NHIA data, NTUH's average for this indicator was 22.18% in 2024, rising to 23.83% in 2025, while the national averages over the same periods were only 5.3% and 5.88%; in quarter 3 of last year NTUH reached as high as 25.94%. And: from 2014 to 2020 it exceeded 24% for 7 straight years, at one point reaching as high as 27.49% in 2015. ↩︎ ↩︎
National Audit Office, A Preliminary Review of the Effectiveness of Tiered Care, Health Workforce Retention, and ED Crowding Mitigation in Recent Years (in Chinese), fiscal year 2025 (ROC 114) (medical center ED case counts, rate of stays over 24 hours, rate of triage level 1–3 transfers to a ward in <8 hours, citing the NHIA DA system). https://www.ly.gov.tw/Pages/ashx/File.ashx?FilePath=~/File/Attach/252810/File_19857052.pdf ↩︎ ↩︎
韓幸紋, [Is there a fix for ED crowding? The fundamental problem with the NHIA's 2025 improvement plan] (in Chinese), Opinion@CommonWealth, May 26, 2025 (citing the MOHW Handbook of Reference Indicators for Global Budget Negotiation). https://opinion.cw.com.tw/blog/profile/545/article/16167 Note: the pre-pandemic range of 2.32%–2.75% comes from this article, not from the National Audit Office report; the National Audit Office's Preliminary Review only lists values from fiscal year 2023 (ROC 112) onward. ↩︎ ↩︎ ↩︎
MOHW National Health Insurance Committee, [NHI Committee members concerned about the results of the new copayment scheme after 1 year] (in Chinese), November 2024. https://dep.mohw.gov.tw/NHIC/fp-4039-80487-116.html ↩︎
Taiwan Society of Emergency Medicine, 2023 (ROC 112) Survey Report on the Practice Status of Emergency Medicine Specialists (in Chinese), August 9, 2023 (the 2023 regional counts of board-certified emergency physicians in Table 8). https://www.sem.org.tw/News/11/Details/1071 ↩︎
Taiwan Society of Emergency Medicine, 2024 (ROC 113) Survey Report on the Practice Status of Emergency Medicine Specialists (in Chinese), August 6, 2024. https://www.sem.org.tw/News/11/Details/1263 ↩︎
Taiwan Society of Emergency Medicine, 2025 (ROC 114) Survey Results on the Practice Registration Status of Emergency Medicine Specialists (in Chinese), November 7, 2025 (survey period April 30–May 9, 2025). https://www.sem.org.tw/News/11/Details/1495 ↩︎ ↩︎ ↩︎
MOHW Department of Statistics, Annual Statistics of Medical Care Services of Medical Institutions, 2025 (ROC 114) (in Chinese), Table 11 "Hospital medical service volume over the years" and Table 12 "Average daily hospital medical service volume over the years," plus Medical Care Services of Medical Institutions: County/City and Township Tables, 2023–2025 (ROC 112–114). https://dep.mohw.gov.tw/DOS/lp-5099-113.html ↩︎
CommonHealth, [ED on the Verge of Collapse! NHIA Launches 3 Plans to Rescue It] (in Chinese), June 5, 2025. https://www.commonhealth.com.tw/article/92787 ↩︎ ↩︎ ↩︎ ↩︎
MOHW, [Hospital Emergency Medical Capability Classification Criteria, with Scoring Explanations and Assessment Methods, 2026 (ROC 115)] (in Chinese), Chapter One "Emergency Care," item 1.1.2 (announced March 6, 2026 [ROC 115] under MOHW Medical Affairs Letter No. 1151661690). Advanced-level original text, translated from Chinese: there shall be 5 or more full-time physicians; where the annual average of ED patient visits over the prior three years is greater than 20,000, 1 full-time physician shall be added for every 5,000 visits in excess; for every 600 visits by which the monthly average of observation-stay visits over the prior three years exceeds, 1 full-time physician shall be added (calculated on the basis of observation-stay visits billed to the NHI). The formula attached to the assessment method is (annual average ED visits over the prior three years−20,000)/5,000)+5, plus monthly average ED observation-stay visits over the prior three years/600. Intermediate-level original text, translated from Chinese: for every 5,000 visits by which the annual average of ED visits over the prior three years exceeds, 1 specialist physician shall be added; formula: required number of specialist physicians = annual average ED visits over the prior three years/5,000. [Note] 3 of the same item also states, translated from Chinese, that ED observation-stay visits are calculated as patient-days using the hospital's NHI billing code for the ED observation bed ward fee. https://www.mohw.gov.tw/dl-99551-e20e3054-0017-491b-8ce6-11506f585e0a.html The same item has identical wording in the 2024 (ROC 113) edition (announced April 11, 2024 [ROC 113] under MOHW Medical Affairs Letter No. 1131662354). https://www.mohw.gov.tw/dl-88320-d82c4390-66a8-48aa-a1f0-3cb12dca53d5.html ↩︎ ↩︎ ↩︎ ↩︎ ↩︎
NHIA, National Health Insurance Medical Service Payment Items and Fee Schedule, Part Two (Western Medicine), Chapter One (Basic Care), Section Three "Ward Fees," notes 1 to 3 under "ED observation bed (per bed/day)." Translated from Chinese: 1. ED patients under observation or waiting for a bed may be billed only after staying a full six hours. 2. For stays exceeding one day (twenty-four hours), billing follows the inpatient ward-fee method, calculated on the principle of counting the day of entry but not the day of exit. 3. Not payable for patients who only receive IV drips, blood transfusions, or rest. Current codes include 03073A/03074B (ward fee, day one), effective May 1, 2025; 03075A/03076B (nursing fee, day one, 914 points); 03018A/03019B (ward fee, from day two); 03042A/03043B (nursing fee, from day two, 703 points); and 02030K "ED observation bed consultation fee," 468 points, newly added in Section Two. ↩︎
MOHW, Standards for Establishment of Medical Care Institutions, Article Three, Appended Table I "Hospital Establishment Standards Table," under personnel, "nursing and midwifery staff." Translated from Chinese: 1. Acute general beds: where there are forty-nine beds or fewer, at least one per four beds; where there are fifty beds or more, at least one per three beds. 2. Where the following units are established, their staffing shall also be calculated per the following: (1) Operating room: at least two per bed. (2) ICU: at least one point five per bed. (3) Delivery room: at least two per delivery table. (4) Burn ward, subacute respiratory care ward: at least one point five per bed. (5) Post-anesthesia recovery room, ED observation room, nursery, hospice ward: at least one per bed. Note 1 of the same table states (translated from Chinese) that when applying to open, nursing and midwifery staff for acute general beds are calculated by the number of open beds, which shows that these coefficients are staffing positions calculated by bed count, not the number on duty at the same time. https://law.moj.gov.tw/LawClass/LawAll.aspx?pcode=L0020025 ↩︎ ↩︎
MOHW Department of Statistics, Hospital Bed Statistics open data, 2021 to 2025 (ROC 110 to 114). The dataset includes 38 bed-category fields such as "ED observation beds," but its statistical unit is the township/city district, not individual hospitals. ED observation beds in Yilan City (township code 3401): 2021 (ROC 110), 24 beds; 2022 (ROC 111), 24 beds; 2023 (ROC 112), 24 beds; 2024 (ROC 113), 24 beds; 2025 (ROC 114), 24 beds. I took the values from each year's original file. Because the statistics are by township/district, and Yilan City has 2 registered hospitals, these 24 beds are the combined count for the two; the public data does not break it down further to individual hospitals. https://dep.mohw.gov.tw/DOS/cp-6601-75361-113.html ↩︎ ↩︎
MOHW, Regulations Governing Emergency Medical Information Reporting, appended table "Emergency Medical Information Reporting Items and Reporting Procedures," main item "Medical Treatment Capability Information," sub-item "Real-time ED Information." Its contents, translated from Chinese: 1. Reported full capacity to 119 2. Number waiting to be seen 3. Number waiting for admission 4. Number waiting for ICU; reporting time: uploaded every thirty minutes, counting from midnight each day. These regulations are promulgated under the authority of Article Thirty-Nine, Paragraph One, Subparagraph Five, and Paragraph Two of the Emergency Medical Services Act. ↩︎
Data source: the NHIA Real-time ED Information for Advanced-Level Emergency Responsibility Hospitals public query service (https://info.nhi.gov.tw/INAE4000/INAE4001S01), which publishes the real-time reporting status of emergency responsibility hospitals nationwide, including whether full capacity has been reported to 119 and the numbers waiting to be seen, waiting for admission, and waiting for ICU. Starting June 17, 2026, I captured and saved this service's public data hourly; through September 5, 2026 I obtained 1,659 records for our hospital (each time point counted only once), of which 853 showed full capacity. By month: June 2026 (from June 17), 58 of 150; July 2026, 318 of 700; August 2026, 386 of 691; September 2026 (through September 5), 91 of 118. Capture coverage differed by month: about 45% for the second half of June 2026 (150/336 on-the-hour slots), about 94% for July 2026, about 93% for August 2026, and about 98% for September 2026; the sample density for June 2026 was clearly lower than for the other months, so keep that in mind when reading its rate. Because capture frequency was once an hour while the statutory reporting frequency is every thirty minutes, this number should be understood as the proportion of sampled moments in full-capacity status, not the number of reports; capture was occasionally interrupted and not every hour has data; periods with no data have unknown status and are not included in the calculation. ↩︎
Central News Agency, [Professional Allowances for Public-Hospital Medical Personnel Raised] (in Chinese), September 14, 2025. On April 22, 2025 the Executive Yuan approved an increase of 7% to 11%, with Tier 1 professionals up 7.5%, Tier 2 up 7.8%, and Tier 3 up 11.5%, implemented May 1, 2025 and retroactive to January 2025. https://www.cna.com.tw/news/ahel/202509140109.aspx Note: this increase applies to all medical personnel at public hospitals, is not ED-specific, and comes from the government personnel budget rather than NHI payments; the various press releases only announced the size of the raises, with no dedicated funding amount to be found. The NHI point-value guarantee of 0.95 is likewise a mechanism for the entire global budget (per a CNA report of July 16, 2024, meeting the target across the board was estimated to require about NT$70 billion), not ED-earmarked. So this row of the table lists no amount. ↩︎
Liberty Times Health, [Holiday Urgent Care Center Shifts Come With Incentives! Physicians Working 9 Straight Night Shifts Over Lunar New Year Can Earn NT$360,000 in Allowances] (in Chinese), September 25, 2025. Original text, translated from Chinese: the pilot is expected to receive NT$300 million; the UCC pilot program totals about NT$300 million, including about NT$22 million for setup and operations, about NT$160 million for personnel, and about NT$114 million for medical costs. The same article also states physician allowances of NT$15,000 for a day shift and NT$20,000 for a night shift, and allowances for nurses, pharmacists, radiologic technologists, and others of NT$4,000 for a day shift and NT$6,000 for a night shift. https://health.ltn.com.tw/article/breakingnews/5191225 ↩︎ ↩︎
SET News, [Hospitals Encouraged to Stay Open Over Next Year's Lunar New Year! MOHW Puts In NT$1.36 billion, Up to Double Payment] (in Chinese), reporter 蔣季容, November 2, 2025. Original text, translated from Chinese: NHIA Director 陳亮妤 said that to encourage medical institutions to provide services during the Lunar New Year, consultation fees, nursing fees, and pharmacy service fees will be raised by 30% to 100%……with an expected injection of NT$1.36 billion (the 2026 [ROC 115] Lunar New Year holiday runs 9 days, February 14–22). https://health.setn.com/news/1745465 ↩︎
CommonHealth, [NT$600 Cheaper Than a Medical Center! But Experts Warn: Without Fixing the Pain Points, Holiday Urgent Care Centers May Be Doomed to Fail] (in Chinese), reporter 邱宜君, October 17, 2025. The original text, translated from Chinese, says physicians are paid NT$15,000–20,000 per shift; UCC runs two shifts on Sundays and national holidays, hours 8–16 and 16–24. https://www.commonhealth.com.tw/article/93172 ↩︎
Business Today / Commercial Times, [Mass exodus of ED physicians! From retreating off the front line to starting clinics] (in Chinese), reporter 馬揚異, November 1, 2025 (the article containing the double-counted 139). https://www.ctee.com.tw/news/20251101700018-430104 ↩︎ ↩︎
United Daily News, [New Holiday Urgent Care Center System Launches in November 2025; Physicians' Union Worries Critical-Care Staff Will Fall Into a Sense of Relative Deprivation] (in Chinese), reporter 沈能元, October 20, 2025 (the physicians' union warned that UCC allowances are relatively generous and may give critical-care staff a sense of relative deprivation, and argued that however many resources go into UCC, equal resources should go into improving the existing critical-care environment). https://udn.com/news/story/7314/9081569 ↩︎
The Reporter, [Data Reporter: Resident Physician Survey] (in Chinese), October 15, 2025. https://www.twreporter.org/a/data-reporter-physician-shortages-by-specialty-and-subspecialty ↩︎
United Daily News, [Woman in Her 80s Dies After Waiting 12 Days for a Bed in the NTUH ED] (in Chinese) (August 2026, https://udn.com/news/story/7266/9713547); [NTUH Insider Reveals More: ED Patient Waited 35 Days for a Bed Before the Abnormality Was Found] (in Chinese) (https://udn.com/news/story/7266/9716451). ↩︎
The Reporter, ['When are you leaving for a clinic?' With no end to ED crowding, physician 'burnout' sparks an exodus] (in Chinese), December 18, 2024. https://www.twreporter.org/a/health-emergency-overcrowding-in-emergency-department ↩︎ ↩︎
Central News Agency, [Can't Be Just the Minimum Wage: MOHW Proposes Guaranteeing Starting Pay for New Medical and Nursing Staff] (in Chinese), November 30, 2025. https://www.cna.com.tw/news/ahel/202511300121.aspx ↩︎


Thoughts on this case? Leave a comment, a like, or a reaction below.
comments powered by Disqus