
Translated from the original Traditional Chinese post. Read the Chinese original →
This is Part 1. The piece comes in two installments: Part 1 covers "why people are leaving" and "whether there really are more patients"; Part 2 covers "why patients can't get admitted," and "why every hospital is raising pay and still can't find anyone."
On the ground: is the ED broken, or just busy?
Night shift hands off, day shift takes over. The moment sign-out ends, I already have 10 to 15 patients who are boarding or still have nowhere to go.
That's before counting whoever walks through the door next.
Four or five years ago, that number was 5 to 7, maybe fewer.
In five or six years, it doubled.
I want to put this picture up front, because it's where every problem in this piece starts. The ED is designed on the premise of "work them up, then move them out": home, or up to a ward. It's a way station, not a ward. But now a day-shift attending hasn't seen a single new patient yet and is already carrying a dozen-plus people who can't be moved. They lie in hallways, in the observation area, waiting for a bed. The longest wait I remember was over three days before the patient finally got upstairs.
One more thing changed in these years: summer isn't slow anymore.
It used to be that in July, August, and September we scheduled only 3 attendings on day shift; those months were our breathing season. These past few years we've had to schedule 4 almost every time, and it's become the norm. Stranger still, with one extra person, everyone feels more tired than before. Each attending's PPH (patients per hour) used to be around 2 or a bit over; now it's consistently above 2.
One more person, and each person sees more. That means in the same stretch of time, our total throughput is up by more than 40%.
The patients are different too. There are far more people over 80 than five years ago; that's a very clear gut sense. And an elderly patient with multiple comorbidities versus a young healthy one takes at least 3 to 5 times as long to manage. Both get written down as "one visit," but the time they actually eat up is nothing alike.
On the staffing side, our hospital's ED is actually fairly stable. Attending turnover is low: fewer people leave, and fewer come in. The real gap is further down: our hospital has one EM residency slot, and we haven't filled it in three or four years.
What that means is the slot has always been there, and it's always been empty. It's not that someone left; it's that no new person came.
And residents have never been just "people still learning." They see patients, they actually take a share of the load, and they discuss with the attending afterward. With a resident around, the attending's patient count is naturally a notch lower. So when that slot sits empty, what's missing isn't just one head; it's the extra patients the attending has to see every shift.
That explains what didn't add up at first: we went from 3 people to 4, yet each person's PPH went from just over 2 to consistently above 2. Because the extra attending is filling what used to be the resident's spot; and what they have to handle is a group of patients older, more complex, and harder to move out than five years ago.
Sign-out itself hasn't gotten longer. Patients with a firm diagnosis and completed workup hand off quickly. What's grown is the other kind: the boarders, the observation patients. Sign-out is no longer "here's how to manage this patient"; it's lots of beds that all need admission and none of them can get upstairs.
All of this is gut feeling. And gut feeling is the easiest thing to brush off with one line: everyone's busy, the ED has always been like this, maybe you're just getting older and can't take it anymore.
So I dug up all the public data and ran the numbers myself. There was really only one thing I wanted to know: is the ED broken, or just busy?
The difference between the two is huge. Busy, you grit your teeth and it passes; over the past 20 years, our ED made it through SARS and through COVID. But if it's broken, no amount of gritting your teeth helps, because broken things don't fix themselves.
The answer was clearer than I expected, and in two places it was the exact opposite of what I'd assumed.
For the past year and a half, nearly every piece of ED news I heard had to do with money. Which hospital simply raised base pay. Far Eastern Memorial Hospital said publicly that in recent years it has given raises to its emergency and critical care physicians every year, with average salary growth of over 15%1; which hospital started bringing retired seniors back to pick up shifts; which hospital's per-shift rate jumped up another tier. If you only looked at these stories, you'd probably think things were looking up for the ED. Seeing everyone get raises, I was practically drooling.
But over the same period, the number of physicians actually standing in the ED didn't go up.
Something about that always felt off to me. Raising pay is the market's most instinctive response to a labor shortage, but after a year and a half of raises, the gap hasn't closed; instead every hospital is crying that it can't find anyone. The money clearly came in. Why didn't the people follow?
I went through the Taiwan Society of Emergency Medicine (TSEM)'s annual practice-status survey reports one by one, and I downloaded the raw statistics files from the Ministry of Health and Welfare (MOHW) and ran them myself. The conclusion was gloomier than I'd expected, and in two places it flatly contradicts the version going around: one is that the number of departures was miscounted; the other is that "more patients" isn't at all what I thought it was.
First, a number that got reported wrong
Since October of last year, one number has been cited over and over2 (translated from Chinese):
In 2024, a total of 139 emergency physicians switched to other specialties or left hospitals, a loss of 6.5% of the workforce.
That number is wrong.
Its source is TSEM's survey report for 2024 (ROC 113)3. The report has two tables: one on changes in "specialty of practice," the other on changes in "practice setting." Here are the original tables, copied as-is:
| Dimension of change | Out | In | No change | Total |
|---|---|---|---|---|
| Specialty of practice (report Table 4.6) — EM ↔ non-EM | 72 | 11 | 1,948 | 2,031 |
| Practice setting (report Table 4.7) — hospital ↔ non-hospital | 67 | 16 | 1,948 | 2,031 |
What the media took were those two bold numbers: 72 + 67 = 139.
The problem is that these two tables ask two different questions: one asks "are you still registered under emergency medicine," the other asks "are you still in a hospital." They count the same 2,031 people, just sliced from two angles. Someone who leaves the hospital for a clinic and changes their registered specialty along the way shows up once in each table. Adding 72 and 67 assumes the two groups don't overlap at all, and the report never says that anywhere.
If you think this is just a theoretical quibble, put the same two tables from the years before and after side by side and it becomes obvious:
| Survey year (changes counted) | Specialty: out + in | Setting: out + in | Denominator |
|---|---|---|---|
| 2023 (ROC 112), 2023 changes4 | 34 + 3 = 37 people | 38 + 2 = 40 people | 1,946 |
| 2024 (ROC 113), 2024 changes3 | 72 + 11 = 83 people | 67 + 16 = 83 people | 2,031 |
| 2025 (ROC 114), 2025 changes5 | 70 + 13 = 83 people | 81 + 27 = 108 people | 2,138 |
In 2024, both sides happen to come to 83, which makes it easy to think "it's the same group of people cut in half." But 2023 is 37 vs. 40, and 2025 is 83 vs. 108. In two of the three years, they don't match. That proves the two tables count two different groups: you can't add them, and you can't treat them as the same group.
The number who actually left emergency medicine in 2024 is 72, not 139.
I'm singling this out not to let anyone off the hook. Quite the opposite. The real number is smaller, but the problem it reveals is far more serious than 139.
The six-year curve
TSEM's survey isn't a questionnaire; it pulls directly from the practice-registration database in MOHW's medical personnel management system, which makes it essentially a full census. Spread across six years, it looks like this3645:
| Year | Out of EM | Into EM | Net out | Out rate |
|---|---|---|---|---|
| 2020 | 35 | 12 | 23 | — |
| 2021 | 25 | 15 | 10 | — |
| 2022 | 28 | 7 | 21 | — |
| 2023 | 34 | 3 | 31 | 1.75% |
| 2024 | 72 | 11 | 61 | 3.55% |
| 2025 | 70 | 13 | 57 | 3.27% |
First I need to clear up something that's easy to misread: the "Into EM" column does not include newly board-certified physicians. It counts people "whose registered specialty was something else and who switched their registration to emergency medicine that year," i.e., people coming back into the ED from another specialty. New grads who just passed the EM boards and register under emergency medicine on their very first registration have never been registered under another specialty, so they don't appear in this column; they come in as new registrations. So "about a hundred newly board-certified emergency physicians a year" and "only a dozen or so moving in a year" don't contradict each other; the two columns count two completely different groups. The accounting further down adds the two separately, and it checks out.
From 2023 to 2024, the out rate jumped from 1.75% to 3.55%, a full doubling. That's not a trend; that's a cliff.
And what stands out even more about 2025 is that it didn't come back down. 70 people, 3.27%, nearly as high as the year before. A one-off shock bounces back; two straight years stuck at the top doesn't. That's called the new normal.
Another line is getting worse too: the number moving "from hospital to non-hospital."
| Year | Hospital → non-hospital | Non-hospital → hospital | Net outflow | Out of EM, same year |
|---|---|---|---|---|
| 20234 | 38 | 2 | 36 | 34 |
| 20243 | 67 | 16 | 51 | 72 |
| 20255 | 81 | 27 | 54 | 70 |
The 81 in 2025 is the highest in six years, and it's more than the 70 who moved out of emergency medicine that same year. That means there's a group of people "still nominally registered under emergency medicine but no longer in a hospital." They didn't change specialty; they just changed where they practice.
The real problem isn't how many left
On its own, 70 isn't actually a lot. 70 out of 2,240 board-certified emergency physicians sounds manageable.
The problem is on the other side of the ledger.
I ran the accounts using TSEM's own numbers. In 2025, 102 people newly passed EM board certification (the cumulative total went from 2,355 to 2,457). And the number actually registered to practice under emergency medicine went from 1,693 to 1,740, a net gain of only 475.
Check it: 1,693 + 102 (new) − 70 (out) + 13 (in) = 1,738, which matches the actual 1,740 almost exactly.
Once you run that, things become clear: virtually 100% of newly board-certified emergency physicians go into the ED, but for every 10 who come in, 7 experienced ones move out.
That's why training output looks fine while the floor is perpetually short-staffed. It's not that we can't recruit new people; it's that we can't keep the people we've already trained. And the ones we're losing are exactly the most experienced, the ones who can carry the load.
1 in every 4.5 board-certified emergency physicians isn't in the ED
Beyond the flows, the stock numbers look even worse345.
| Year | Cumulative passed EM boards | Newly passed that year | Practicing board-certified EPs | Registered EM | Registered non-EM | Non-EM share |
|---|---|---|---|---|---|---|
| 2023 | 2,248 | — | 2,054 | 1,664 | 390 | 18.99% |
| 2024 | 2,355 | +107 | 2,139 | 1,693 | 446 | 20.85% |
| 2025 | 2,457 | +102 | 2,240 | 1,740 | 500 | 22.32% |
"Newly passed that year" is obtained by subtracting consecutive cumulative totals (2,355−2,248 = 107, 2,457−2,355 = 102). The training pipeline reliably produces around a hundred people a year, no problem at all; the problem is entirely in those three columns on the right.
Read the "Registered non-EM" column carefully: all 500 of these people hold EM board certification; they're part of the 2,240 "practicing board-certified EPs." The only difference is that the specialty they currently have registered with MOHW isn't emergency medicine. In other words, it's not that they aren't qualified; it's that they've stopped doing it.
Three straight years of increase. By 2025, 1 in every 4.5 physicians qualified in emergency medicine is no longer practicing in the ED.
Where did those 500 go? TSEM's report breaks it down by hospital level:
| Practice setting | Registered EM (1,740) | Registered non-EM (500) |
|---|---|---|
| Medical centers | 543 (31.21%) | 22 (4.40%) |
| Regional hospitals | 835 (47.99%) | 38 (7.60%) |
| District hospitals | 330 (18.97%) | 39 (7.80%) |
| Other (clinics, aesthetic medicine, health checkups, and other non-hospital facilities) | 32 (1.84%) | 401 (80.20%) |
Compare the two columns and it's plain: of those still registered under emergency medicine, 98% are in hospitals of some level; while of the 500 registered under other specialties, 80% land in "Other," i.e., clinics, aesthetic medicine, health checkups, and similar non-hospital facilities5. That lines up exactly with what The Reporter found: 300 new self-pay clinics in three years, pulling emergency and critical care doctors and nurses away7.
What about the 22 people "at medical centers but registered under a non-EM specialty"? TSEM's report only pulls registration results and doesn't record reasons, so what follows is my guess, not something the report says: a physician can register only one specialty of practice, so dual-boarded physicians who hold EM plus another specialty (critical care, internal medicine, family medicine, occupational medicine, etc.) and register under the other one land in this cell; the same goes for people who moved into administrative roles or to non-ED units within the hospital (ICU staff, health-checkup centers, hyperbaric oxygen, the education department). This cell has only 22 people, 4.4% of the 500, so it's not the main story. The main story is the 401 who left hospitals.
There's another structural problem hidden under these numbers: age. Of the 2,240 currently practicing, the 40–49 bracket is the core (839 people, 37.5%), but those 50 and over already make up 33.5% (750 people)5. This is the group least likely to work consecutive overnight shifts, yet they account for a third of the headcount on paper.
The 2,240 on paper and "the people you can actually put on a 24-hour rotation" have never been the same number.
I thought it was more patients. The data says something else
Everything so far has been supply. But if demand hadn't changed, losing 70 people would be survivable.
My own gut sense was very clear: after the pandemic, especially these last two or three years, summer stopped being slow. In the summer months we used to schedule only 3 attendings on day shift; these past few years we've had to schedule 4 almost every time, and it's become the norm. Scheduling one more person isn't a small thing: it means the whole department's baseline staffing went up by one, and it has never come back down.
So I originally assumed the data would show more patients. It didn't.
ED visits at hospitals nationwide have actually not returned to pre-pandemic levels8:
- 2019: 7.64 million visits (daily average 20,934)
- 2020: 6.59 million | 2021: 6.61 million (the pandemic trough)
- 2022: 8.24 million (the peak in the Omicron year)
- 2023: 7.75 million | 2024: 7.48 million
- 2025: 7.53 million visits (daily average 20,639)
In other words, ED visits in 2025 were 1.4% lower than in 2019. Looking at this line alone, the ED should be easier than before the pandemic.
Source: MOHW Department of Statistics, Annual Statistics of Medical Care Services of Medical Institutions (in Chinese), Tables 11 and 12.
But break it down by age and the picture looks completely different. Using the MOHW Department of Statistics' ED visit data, 2019 vs. 2024910:
- 65 and over: 3.594 million → 4.156 million visits, up 15.7% (563,000 more visits)
- Age 15–64: 7.082 million → 6.795 million visits, down 4.1%
- Age 0–14: 1.677 million → 1.594 million visits, down 4.9%
- Share of all ED visits that are 65 and over: 29.09% → 33.13%
Source: MOHW Department of Statistics open government data, ED Visit Statistics by Sex and Age (in Chinese).
Put another way, the "extra" ED patients of these five years are all elderly, and then some. ED volume among young adults and children actually shrank. The ED's total volume didn't change, but the people inside it were swapped out.
The next question is even more important: are older people just going to the ED more readily?
No. The same dataset has an "ED visit rate per 100,000 population." Lay out each age group's rate from 2019 to 2024 and nearly all of them are flat or down:
| Age group | Male | Female |
|---|---|---|
| 65–69 | −4.7% | −7.8% |
| 70–74 | −5.3% | −8.0% |
| 80–84 | −5.5% | −5.3% |
| 85 and over | +0.3% | −2.3% |
| All ages combined | −1.1% | −0.3% |
Nine of the ten cells are negative; the only positive one is men 85 and over at +0.3%, small enough to call flat11.
People in every age group aren't going to the ED any more often; if anything, slightly less. The ED has more old people purely because there are more old people. When you get down to it, it's a multiplication:
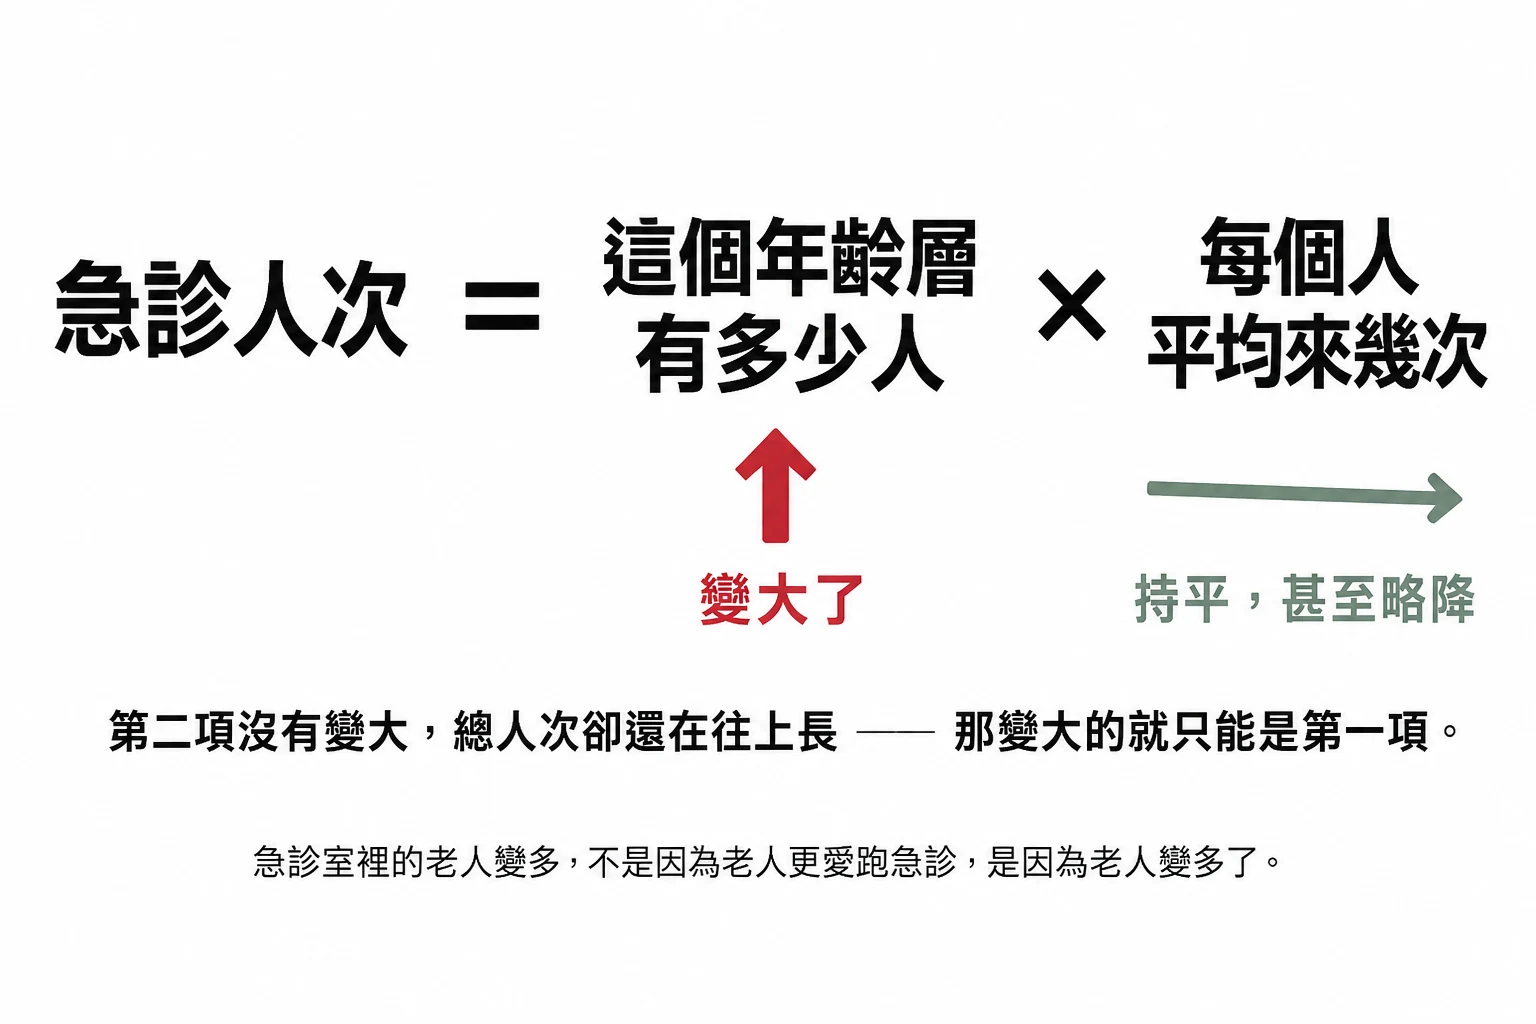
Source: MOHW Department of Statistics open government data, ED Visit Statistics and ED Visit Rate Statistics (in Chinese); calculations by the author.
The extra patients didn't grow out of behavior; they grew out of the population. At the end of 2025, Taiwan's population aged 65 and over reached 4,673,155, 20.06% of the total, officially making it a super-aged society12.
The reason this is so deadly is that the ED visit rate has a very steep age gradient11:
- Men aged 40–44: 13,355 visits per 100,000 population
- Men aged 65–69: 19,085 visits
- Men 85 and over: 50,718 visits, 3.8 times the 40-something group
So when the population structure shifts older, ED load grows on its own even if nobody's behavior changes at all. This isn't a care-seeking-habit problem, and it won't be turned around by patient education or copayment adjustments.
And "visits" badly understates the actual workload. An 85-year-old with multiple comorbidities, on anticoagulants, who can't give a clear history, and a 30-year-old with gastroenteritis are both "1 visit" in the statistics. But the time, the tests, the phone calls, and the risk the first one takes are several times the second. And they're more likely to need admission, which runs them straight into the next wall.
I think this is also why summer isn't slow anymore. The ED's traditional high and low seasons were propped up by infections: influenza, enterovirus, rotavirus. Those are diseases of kids and young people, clearly seasonal, so summer naturally eased off. But elderly multimorbidity has no off-season. When the core of the ED shifted from "seasonal infections" to "elderly multimorbidity," those months where we used to catch our breath got filled in. (This paragraph is my explanation inferred from age structure; MOHW's public statistics are annual only, with no monthly data to verify it directly.)
There was another claim I assumed would hold up and didn't once I checked: that fewer hospitals offer emergency care, so the remaining ones are more crowded. The total number of hospitals nationwide is indeed falling: 480 in 2019, 460 in 2025, down 20 in six years8. But the group actually taking emergency patients, the emergency-responsibility hospitals designated and monitored by MOHW, has barely moved in six years: 205 in 2020, 206 in 2022, 206 in 2024, 205 in 202513. The 20 hospitals that disappeared did not show up in the count of emergency-responsibility hospitals. So ED crowding can't be blamed on "fewer hospitals."
The only thing moving is the tier structure: advanced-level emergency-responsibility hospitals went from 46 in 2020 to 53 in 2025, while general-level ones fell from 84 to 7713. Hospitals didn't decrease, but responsibility for critical patients is concentrating upward.
At this point someone is bound to ask: elderly ED visits up 15.7% in five years: is that because older people "need the ED more," or simply because "there are more older people"? These two have completely different policy implications, so I broke it down and ran it.
ED visits can be split into three multipliers: visits = population × prevalence (share of the population who visited the ED at least once in a year) × visit frequency (average visits per patient). The "ED visit rate per 100,000 population" that MOHW publishes uses deduplicated heads, not visits, as its numerator. Using it to back-calculate the total population, I got 23.6 million, which matches Taiwan's actual population exactly, confirming that definition14.
Age 65 and over, 2019 vs. 202491114:
- Population: 3.520 million → 4.393 million, +24.8%
- Prevalence: 27.10% → 25.52%, −5.8%
- Visit frequency: 3.77 → 3.71 visits, −1.6%
- Resulting ED visits: 3.594 million → 4.156 million, +15.7%
Source: MOHW Department of Statistics, ED Visit Statistics, ED Visit Rate Statistics, and ED Patient Count Statistics (in Chinese); three-factor decomposition calculated by the author.
In other words, the population structure would have pushed elderly ED volume up 24.8%; it was only because the share of older people visiting the ED and how often they came both fell that it was pressed back down to 15.7%. If older people's care-seeking behavior hadn't changed at all over these five years, elderly ED volume in 2024 would have been another 330,000 visits higher than it actually was.
This result is worth pausing on. What it means is: the ED got busier not because older people became more eager to go to the ED, but because there are more older people. The blame doesn't lie with the public's care-seeking behavior; if anything, public behavior moved a bit toward "more restraint."
As an aside, the kids are even more counterintuitive: ED visits for ages 0–14 fell 4.9%, but broken down, the population dropped 8.6% (low birth rate), while how often each child goes to the ED actually rose 3.5%914. Per-child pediatric ED use is going up; the denominator is just shrinking faster.
So what about the claim that "everyone rushes to the ED for every little thing"? That was another assumption I thought would hold, and the official data points the opposite way.
A formal November 2024 document from MOHW's National Health Insurance Committee put it bluntly: at every hospital level, the share of low-acuity ED cases (triage levels 4–5) was lower than before the pandemic (2019, ROC 108). Shih Chung-liang, then Director-General of the National Health Insurance Administration (NHIA), gave the declines as 2.27% to 6.43%15. The share of low-acuity cases didn't rise; it fell.
The real problem is hidden in triage level 3. The ED triage distribution at medical centers nationwide is roughly: level 1 3.47%, level 2 17.4%, level 3 64.95%, level 4 12.94%, level 5 1.24%16. Level 3 alone takes up two-thirds. That's the "urgent but not emergent" group, and it's exactly the level where elderly multimorbidity is most concentrated. These patients don't come and go quickly; they need labs, imaging, consults, and a high proportion of them end up needing admission.
So you get this contradictory picture: low-acuity patients are being kept out, yet the ED is more jammed. The government's own indicators make it very clear: patients aren't failing to get in; they're failing to get out1715.
Source: National Audit Office, A Preliminary Review of the Effectiveness of Tiered Care, Health Workforce Retention, and ED Crowding Mitigation in Recent Years (in Chinese), 2025 (ROC 114) (citing the NHIA DA system); boarding time from the minutes of the November 2024 meeting of MOHW's National Health Insurance Committee.
Here's the thing that says it best: in July 2023, the ED copayment at medical centers went up from NT$450 to NT$750, and at regional hospitals from NT$300 to NT$400, with the explicit goal of pushing people out to primary care. And the result? In 2024, ED cases at medical centers went up, not down, from 1,818,785 to 1,913,390, and their share of all hospital ED cases actually rose from 24.32% to 26.28%. That's from the National Audit Office's report17.
So the "use price to push patients away" approach has already been proven ineffective by the government's own data. The reason isn't hard to figure out: the people who really need to come to a medical center won't stay away over an extra NT$300; and the people who would be scared off by NT$300 were never the ones clogging the ED in the first place.
Academics have seen this shift from another angle too.
The key isn't how many people "came to" the ED, but how much work the ED "has to handle." And in recent years, those two things have completely decoupled.
Professor 韓幸紋 of the public finance and tax administration department at National Taipei University of Business, analyzing ED crowding, points out that ED load shouldn't be measured by visits alone, but by "ED points"18. Let me be clear about what points are: they're the total a hospital bills after pricing every single thing done during an ED visit item by item under the NHI (Taiwan's National Health Insurance) fee schedule: the consultation fee, blood tests, X-rays and CT scans, procedures, drugs, and the bed and nursing fees for an observation bed each carry their own points; at one point to one NT dollar, ED points equal ED medical expenditure. For the same patient, one more CT, one more set of labs, one more day on an observation bed, and the points stack up. So it measures "how much was done," not "how many people came."
I downloaded the ED tables from MOHW's National Health Insurance Medical Statistics Annual Report across the years and ran them myself. The advantage is that visits and points are in the same table, so there's no need to compare across datasets. From 2019 to 2024, national ED visits rose only 1.6%, but NHI points billed for the ED rose 19.7%; per visit, that went from 1,962 points to 2,312 points, up nearly 18%19. The same person walks into the ED, and we have to do nearly 20% more: one more set of labs, one more CT, one more day in observation, layer upon layer. That's exactly what the older, sicker patients described above produce. (One limitation I should state up front: points get pushed up by increases in the NHI fee schedule, and the ED consultation fee has been raised several times in recent years, so part of that 19.7% is price, not volume.)
Source: MOHW Department of Statistics, National Health Insurance Medical Statistics Annual Report (in Chinese), 2016–2024 (ROC 105–113), statistical section "IX. ED Visit Statistics," Tables 7 and 13; downloaded and recalculated by the author.
The same analysis has two more numbers worth remembering: the share of ED patients staying over 24 hours was roughly 2.32%–2.75% before the pandemic, and hit a record high in H1 2024, a full percentage point higher; and the number of acute general beds nationwide in 2023 saw its first-ever decline: 182 fewer beds in the Northern region, 152 fewer in the Central region, 171 fewer in Kaohsiung-Pingtung18.
Why would beds decrease? Because the nurses left, and the beds can't be opened.
This is the domino chain everyone knows about but that's very hard to change:
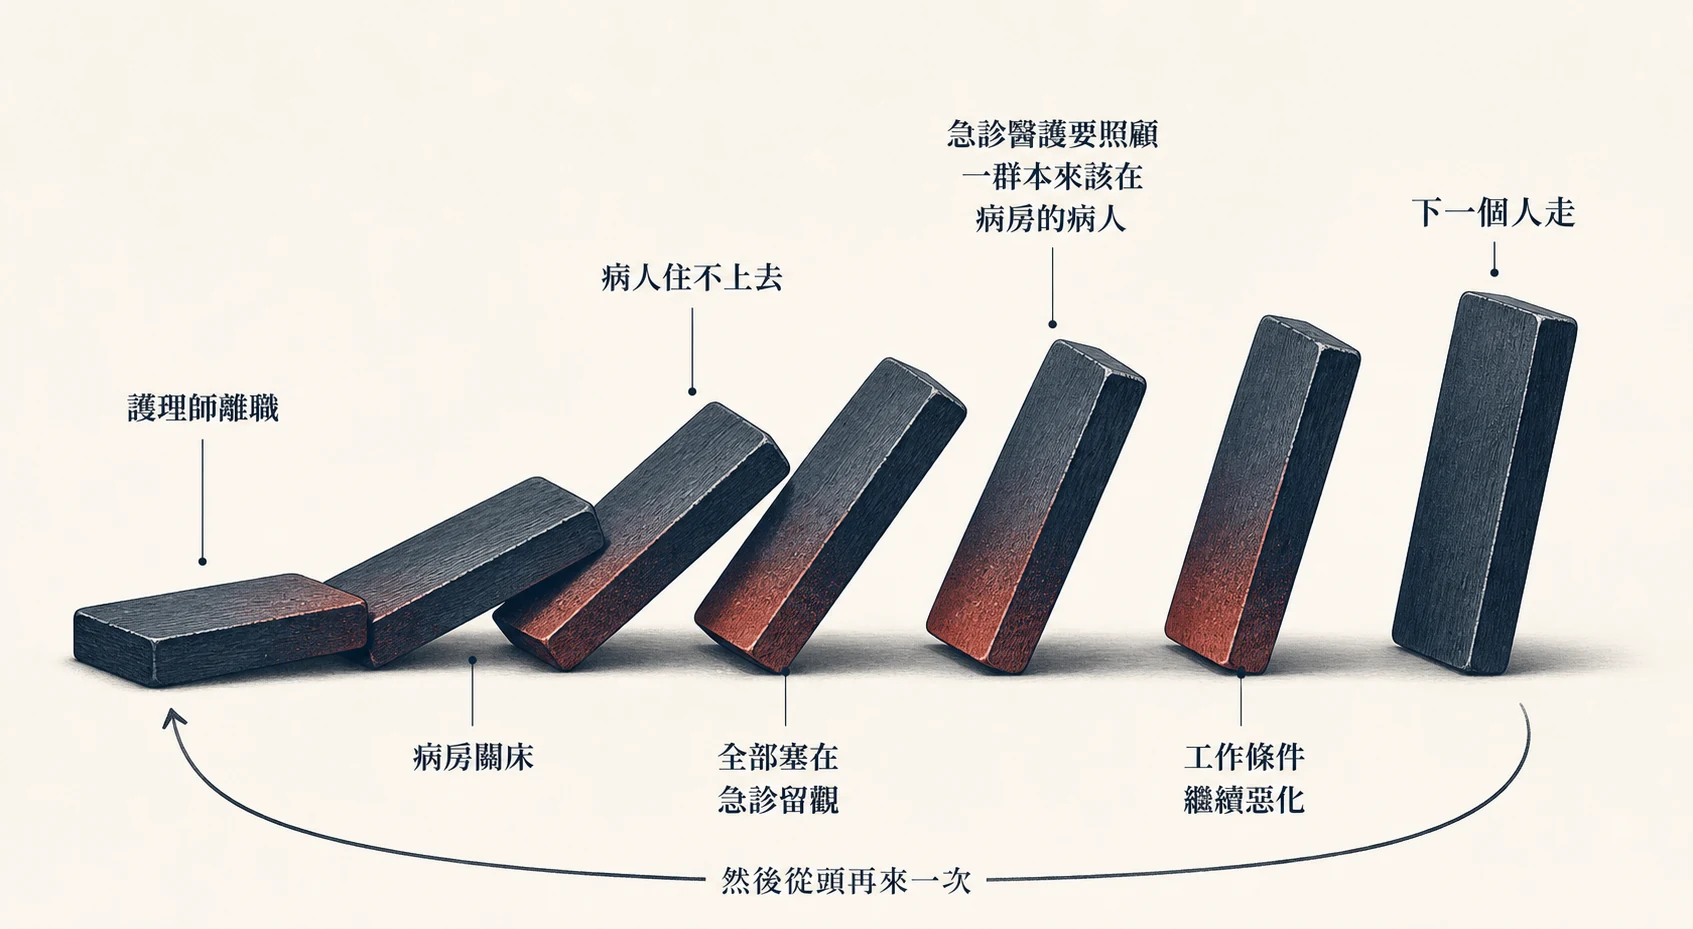
What does this domino chain look like in my own ED? Apart from the head nurse and the assistant head nurse, the most senior of everyone else is probably not even 30. Those are the only ones who stayed. For an ED nurse to run triage, CPR, intubation, and mass casualties smoothly, what it takes is years ground in by patients, and a few classes can't make that up. When a unit's seniority is down to two people holding it up, every person who leaves takes with them things that can't be handed off.
And ED nurses sit at the very end of this chain, yet they aren't covered by the three-shift nurse-to-patient ratio rules. On the wards, one nurse caring for 6 patients is protected by regulation; an ED nurse looking after 20 to 30 alone is not. TSEM's 2024 survey showed that more than 40% of hospitals saw ED nursing staff decrease, with medical centers losing an average of 6.6 nurses each3. MOHW's latest figures show that from January to July 2026, the number of practicing nurses in Taiwan fell by another 82720.
That leaves one last piece of the puzzle: can these older, sicker patients actually get admitted in the end?
Part 2 | Patients can't get admitted, and money can't buy people back — Why do patients who need admission get stuck in the ED? The 48-hour boarding rate, the blind spots in official indicators, and why this year and a half of pay raises hasn't stopped the bleeding.
References
United Daily News, [Health Sustainability Champions / Far Eastern Memorial Hospital's five strategies to retain talent; staff turnover falls] (in Chinese), reporter 李樹人, September 6, 2025. https://udn.com/news/story/7266/8986699 ↩︎
Business Today / Commercial Times, [Mass exodus of ED physicians! From retreating off the front line to starting clinics] (in Chinese), reporter 馬揚異, November 1, 2025 (the article containing the double-counted 139). https://www.ctee.com.tw/news/20251101700018-430104 ↩︎
Taiwan Society of Emergency Medicine, 2024 (ROC 113) Survey Report on the Practice Status of Emergency Medicine Specialists (in Chinese), August 6, 2024. https://www.sem.org.tw/News/11/Details/1263 ↩︎ ↩︎ ↩︎ ↩︎ ↩︎ ↩︎
Taiwan Society of Emergency Medicine, 2023 (ROC 112) Survey Report on the Practice Status of Emergency Medicine Specialists (in Chinese), August 9, 2023. https://www.sem.org.tw/News/11/Details/1071 ↩︎ ↩︎ ↩︎ ↩︎
Taiwan Society of Emergency Medicine, 2025 (ROC 114) Survey Results on the Practice Registration Status of Emergency Medicine Specialists (in Chinese), November 7, 2025 (survey period April 30–May 9, 2025). https://www.sem.org.tw/News/11/Details/1495 ↩︎ ↩︎ ↩︎ ↩︎ ↩︎ ↩︎ ↩︎
蔡杰勳, [Booming in Aggregate, Unbalanced in Structure: The Workforce Vacuum in Taiwan's Healthcare Seen Through the 'Big Five Empty' Crisis] (in Chinese), 2025 Win the PRIDE competition essay, School of Medicine, National Yang Ming Chiao Tung University. (The three rows for 2020–2022 in the table are cited secondhand from this essay and were not checked one by one against TSEM's original reports; this essay's figures for 2023 and 2024 match the original reports exactly.) ↩︎
The Reporter, ['When are you leaving for a clinic?' With no end to ED crowding, physician 'burnout' sparks an exodus] (in Chinese), December 18, 2024. https://www.twreporter.org/a/health-emergency-overcrowding-in-emergency-department ↩︎
MOHW Department of Statistics, Annual Statistics of Medical Care Services of Medical Institutions, 2025 (ROC 114) (in Chinese), Table 11 "Hospital medical service volume over the years" and Table 12 "Average daily hospital medical service volume over the years," plus Medical Care Services of Medical Institutions: County/City and Township Tables, 2023–2025 (ROC 112–114). https://dep.mohw.gov.tw/DOS/lp-5099-113.html ↩︎ ↩︎
MOHW Department of Statistics open government data, 3. ED Visit Statistics by Sex and Age (in Chinese) (2016–2024, ROC 105–113). https://dep.mohw.gov.tw/DOS/cp-6600-74522-113.html ↩︎ ↩︎ ↩︎
The ED visit figures cited in this post come from two official statistics with different coverage, so their absolute values can't be divided across each other. The "total visits" in the previous section come from the hospital ED visits in Table 11 of the MOHW Department of Statistics' Annual Statistics of Medical Care Services of Medical Institutions: 7.64 million in 2019, 7.48 million in 2024, 7.53 million in 2025. The age-specific visits and shares in this section come from the Department's open government data, ED Visit Statistics by Sex and Age, which has a larger population: 2019 total 12,352,512 visits (of which 65 and over 3,593,511 visits, 29.09%), 2024 total 12,545,504 visits (of which 65 and over 4,156,451 visits, 33.13%). The three age groups in this section add up to the latter's population, which does not equal the hospital ED visits in the previous section. The two statistics reach the same conclusion on "whether total ED volume has increased": between 2019 and 2024, the former changed −2.1% and the latter +1.6%, both within ±2%. (Note also: this open dataset includes a "disease category" field; a single visit can map to multiple disease categories, and the sum across categories is about 1.95 times the total, so only rows where "disease category = total" can be used to count overall volume.) https://dep.mohw.gov.tw/DOS/cp-6600-74522-113.html ↩︎
MOHW Department of Statistics open government data, 1. ED Visit Rate Statistics by Sex and Age (in Chinese) (2016–2024, ROC 105–113). https://dep.mohw.gov.tw/DOS/cp-6600-74520-113.html ↩︎ ↩︎ ↩︎
Central News Agency, [Taiwan officially became a super-aged society in 2025; newborns hit another record low] (in Chinese), January 9, 2026 (citing Ministry of the Interior population statistics). https://www.cna.com.tw/news/ahel/202601090067.aspx ↩︎
MOHW Department of Statistics, Annual Statistics of Medical Care Services of Medical Institutions (in Chinese), "Number of hospitals by emergency medical capability level and medical region" (Table 47 for 2020 (ROC 109) and 2022 (ROC 111), Table 47 for 2024 (ROC 113), Table 46 for 2025 (ROC 114)). Values were taken year by year from the original files of each annual report: 2020 (ROC 109) total 205 (advanced 46 / intermediate 75 / general 84), 2022 (ROC 111) 206 (46/77/83), 2024 (ROC 113) 206 (52/74/80), 2025 (ROC 114) 205 (53/75/77). This table counts emergency-responsibility hospitals that have been graded for emergency medical capability by MOHW, which is not the same population as the "national number of hospitals" (Table 12). https://dep.mohw.gov.tw/DOS/lp-5099-113.html ↩︎ ↩︎
MOHW Department of Statistics open government data, 2. ED Patient Count Statistics by Sex and Age (in Chinese) (used to back-calculate population for the three-factor decomposition). https://dep.mohw.gov.tw/DOS/cp-6600-74521-113.html The three-factor decomposition (population / prevalence / visit frequency) was calculated by the author and is not an officially published analysis. ↩︎ ↩︎ ↩︎
MOHW National Health Insurance Committee, [NHI Committee members concerned about the results of the new copayment scheme after 1 year] (in Chinese), November 2024. https://dep.mohw.gov.tw/NHIC/fp-4039-80487-116.html ↩︎ ↩︎
The Reporter, [ED care is 'in resuscitation': who paralyzed the emergency room?] (in Chinese) (five-level triage distribution in medical center EDs, cited secondhand from MOHW statistics, year not specified; used to illustrate structural proportions and not suitable for year-to-year comparison). https://www.twreporter.org/a/emergencyroom ↩︎
National Audit Office, A Preliminary Review of the Effectiveness of Tiered Care, Health Workforce Retention, and ED Crowding Mitigation in Recent Years (in Chinese), 2025 (ROC 114) (medical center ED case counts, share staying over 24 hours, share of triage level 1–3 patients admitted to a ward in <8 hours, citing the NHIA DA system). https://www.ly.gov.tw/Pages/ashx/File.ashx?FilePath=~/File/Attach/252810/File_19857052.pdf ↩︎ ↩︎
韓幸紋, [Is there a fix for ED crowding? The fundamental problem with the NHIA's 2025 improvement plan] (in Chinese), Opinion@CommonWealth, May 26, 2025. https://opinion.cw.com.tw/blog/profile/545/article/16167 ↩︎ ↩︎
MOHW Department of Statistics, National Health Insurance Medical Statistics Annual Report (in Chinese), 2016–2024 (ROC 105–113), statistical section "IX. ED Visit Statistics," Table 7 (ED visit statistics) and Table 13 (ED medical expenditure statistics). Downloaded and recalculated by the author. https://dep.mohw.gov.tw/dos/lp-5103-113.html ↩︎
United Daily News, [Nursing shortage: 20% raises, yet half a year later still 800 fewer] (in Chinese), August 2026 (MOHW statistics: practicing nurses decreased by 827 from January to July 2026). https://udn.com/news/story/7266/9725810 ↩︎


Thoughts on this case? Leave a comment, a like, or a reaction below.
comments powered by Disqus