Translated from the original Traditional Chinese post. Read the Chinese original →
The basics
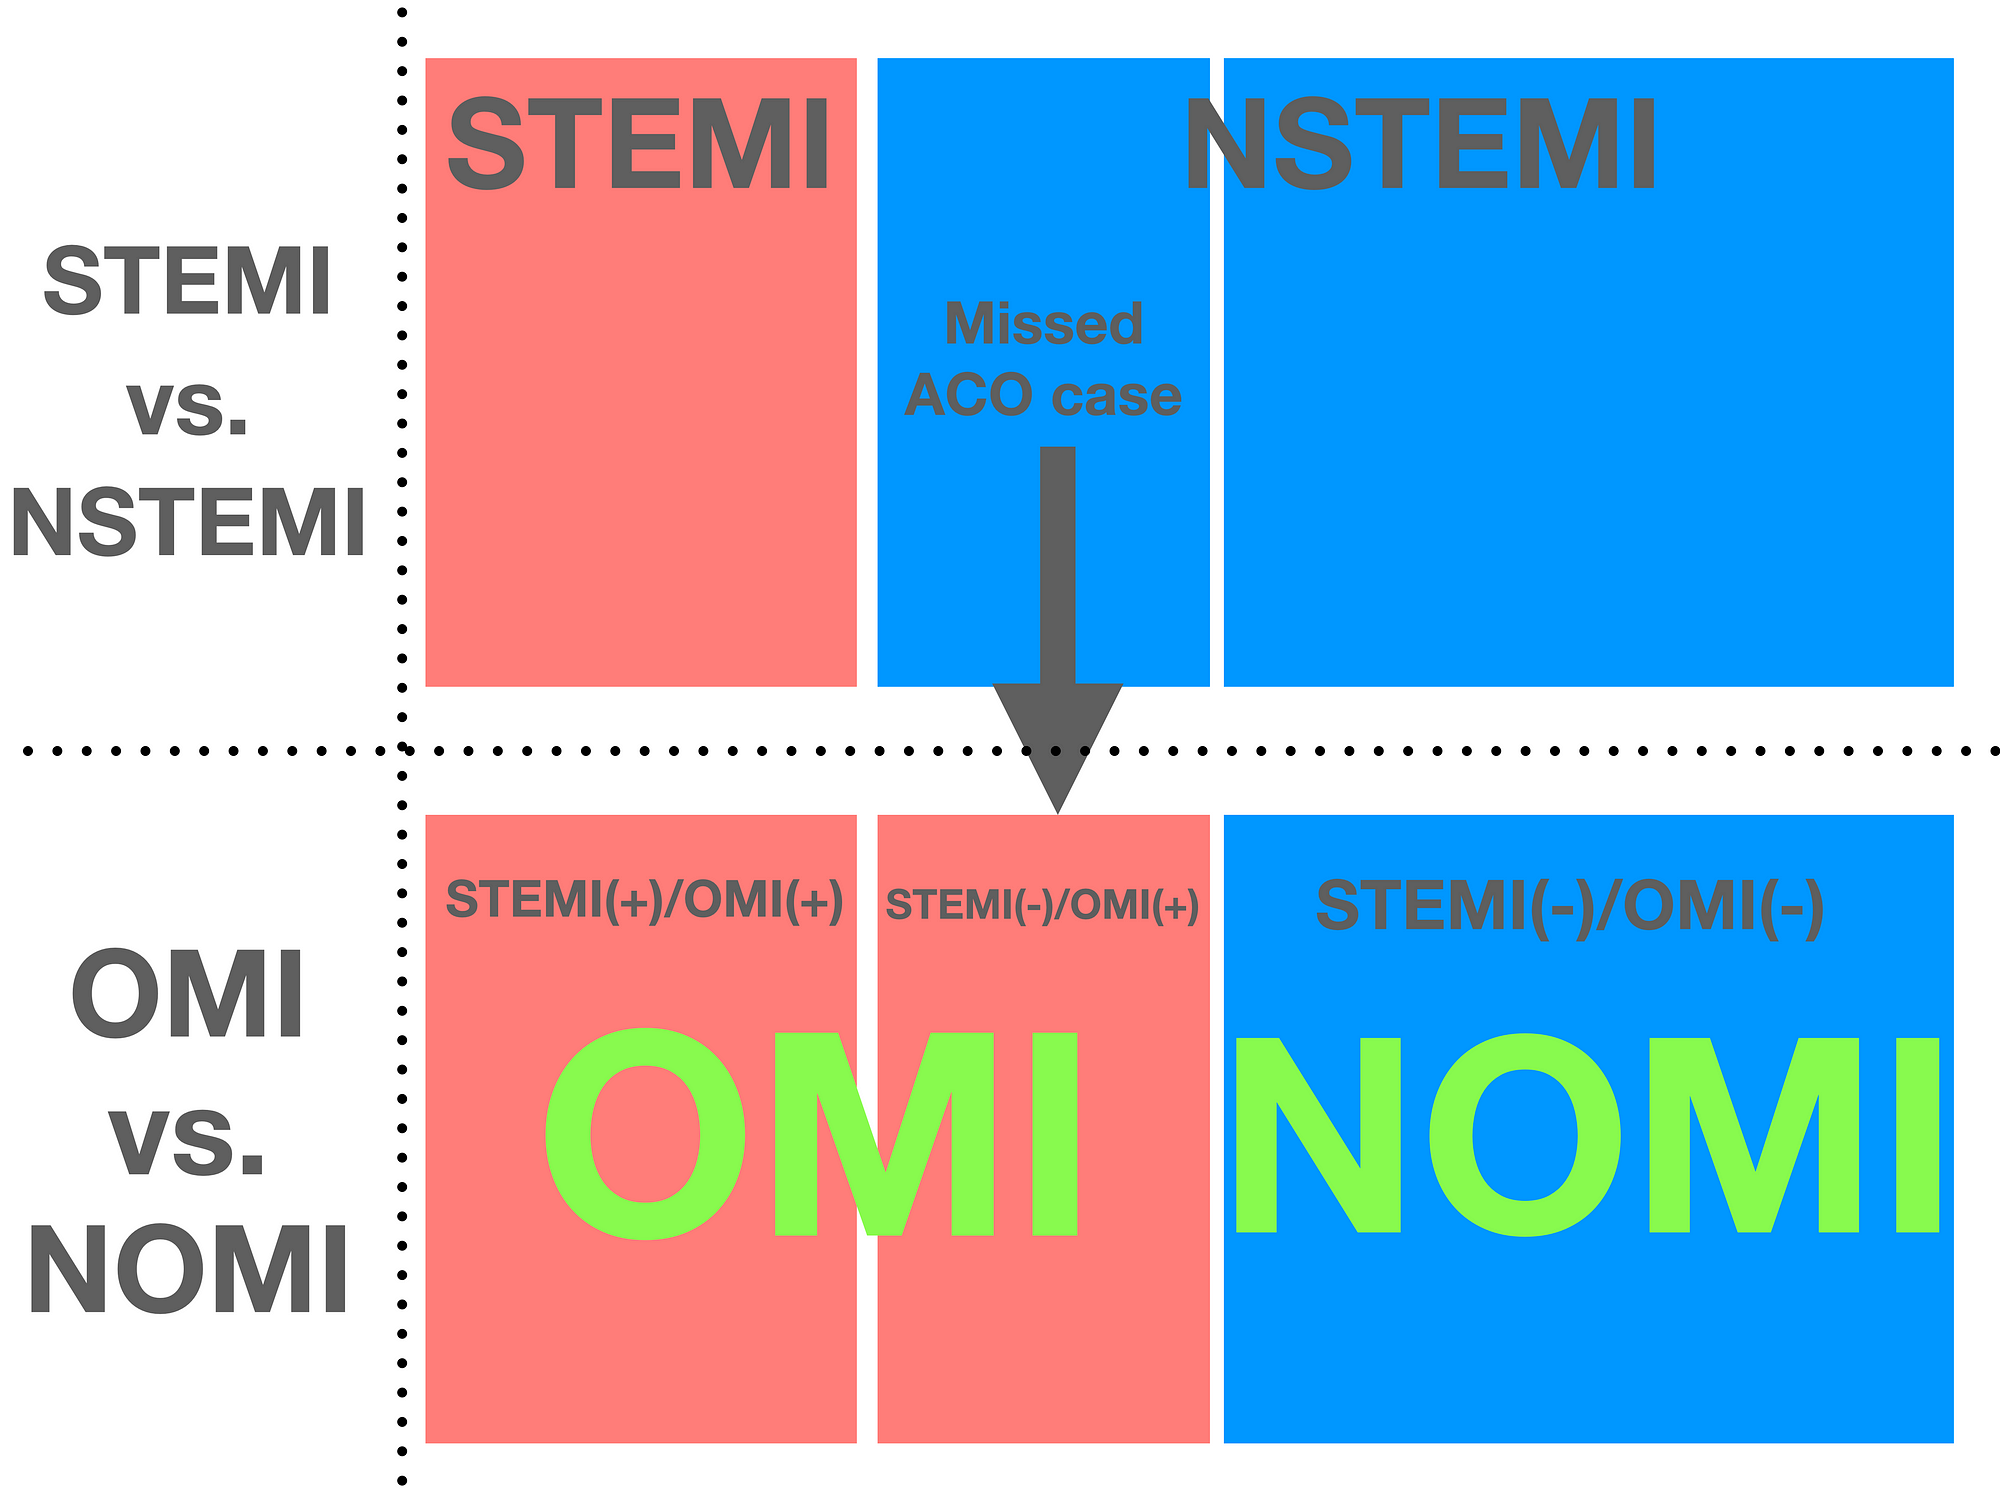
The OMI concept was put forward in 2018 by Stephen W. Smith, Pendell Meyers, and Scott Weingart. The main reasoning was that the current STEMI criteria are not a good tool for identifying which patients will benefit from PCI. So they introduced OMI as a better way to find ACO (Acute coronary occlusion).
The new OMI/NOMI paradigm is not limited to the ECG, but the ECG is still the cornerstone of the concept, mainly because it's fast, repeatable, non-invasive, and already in wide use.
Because every ECG sign has its own pretest probability, the ECG has to be read in the context of the patient's clinical presentation before and after it, whether chest pain is present, and what that pain is like. This matters even more when the ECG finding is very subtle. (For example, if there's STE but the patient has no chest discomfort at all, you may want to think about other problems.)
Of ED patients presenting with chest pain, only 2~5% actually have OMI. And only half of those meet STEMI criteria.
Remember the STEMI criteria?
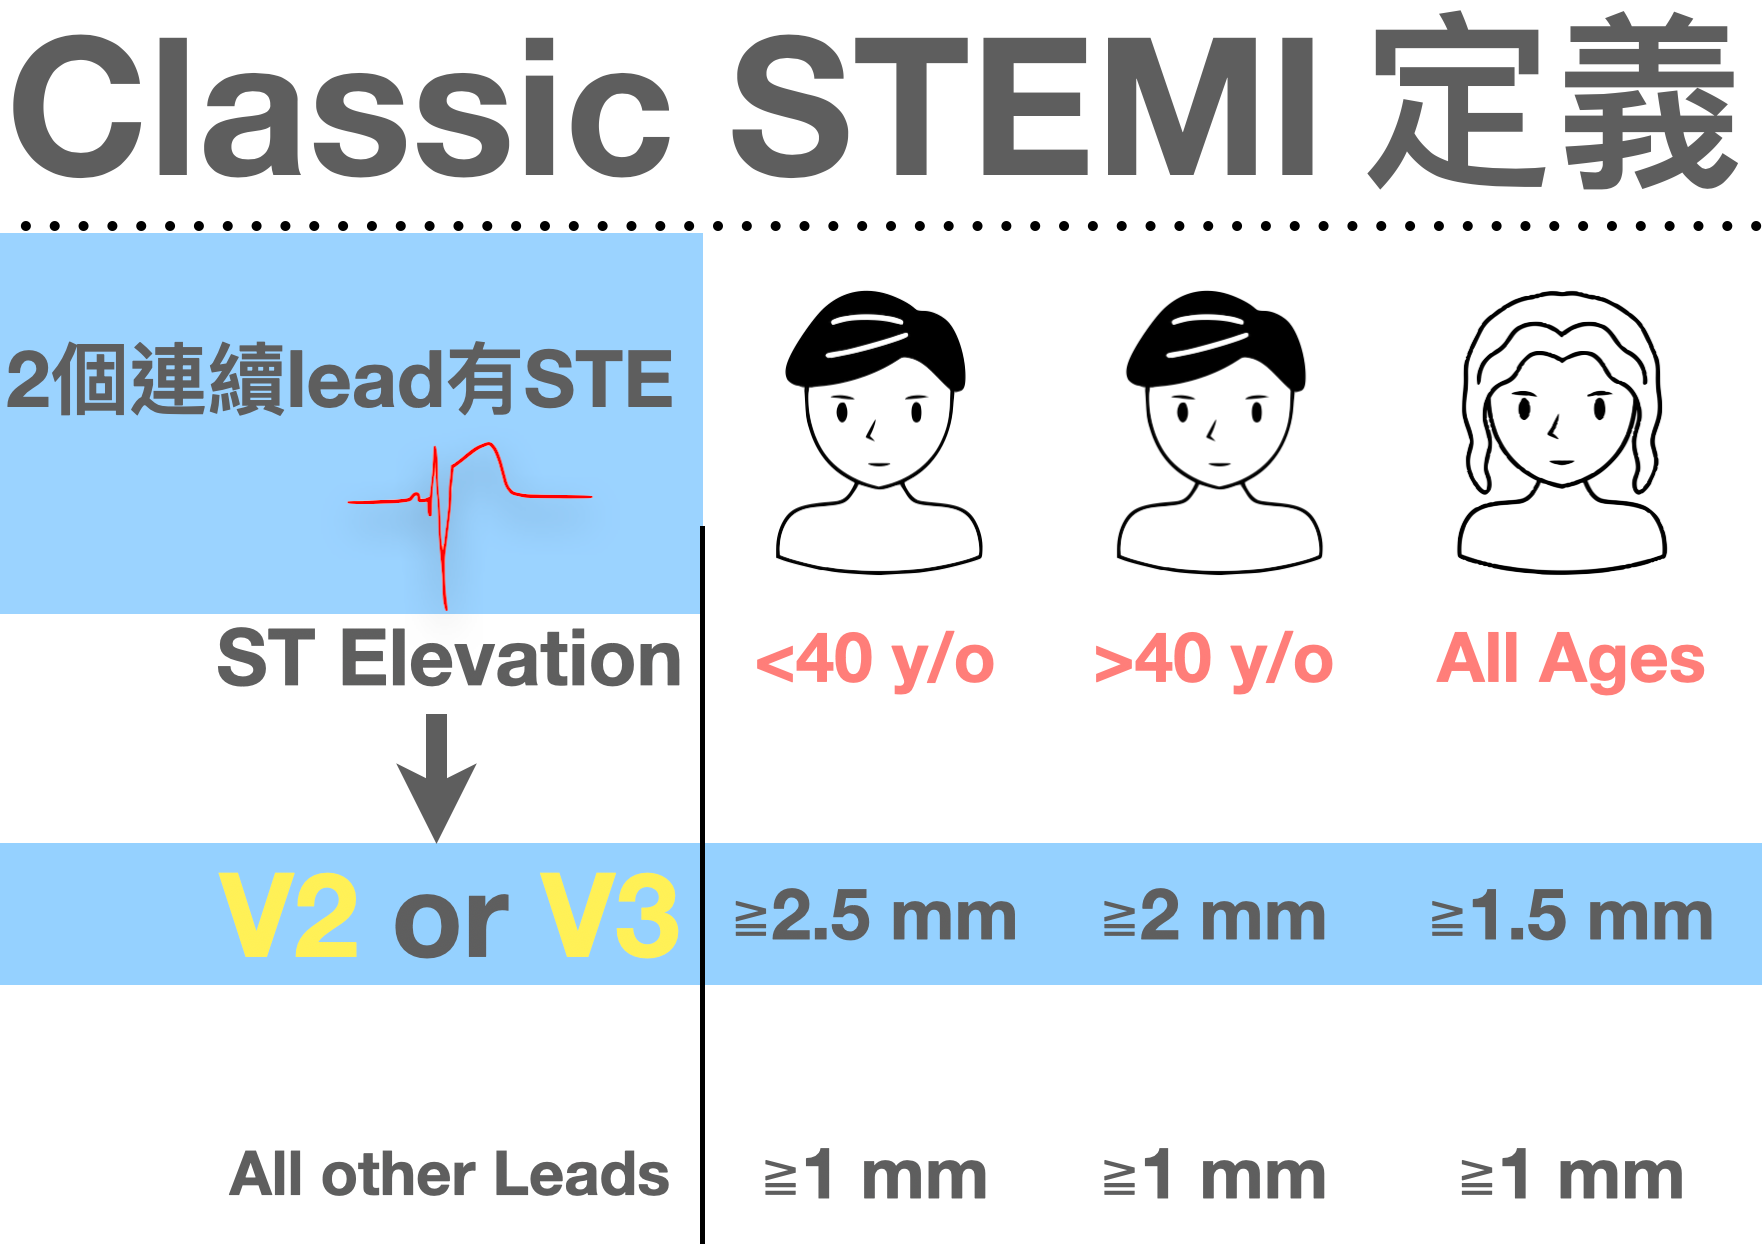
This article uses 10 steps to work out which situations may be OMI and which look less like OMI.1
Assessing the ECG this way lets us find OMI patients faster, so we can consult cardiology appropriately and salvage the remaining myocardium.

10 Steps to clarify the OMI
When there is obvious STE
Step 1: Rule out artifact
First check for an Atrial Repolarization wave (ARW) or atrial flutter ➡ these can produce an STE appearance (commonly in the inf.leads)
- First see whether the Inf.leads have a Negative P wave. If they do, the impulse isn't coming down from the sinus node; it's coming from the low atrium, so look at the figure below (Fig 1) 2 :
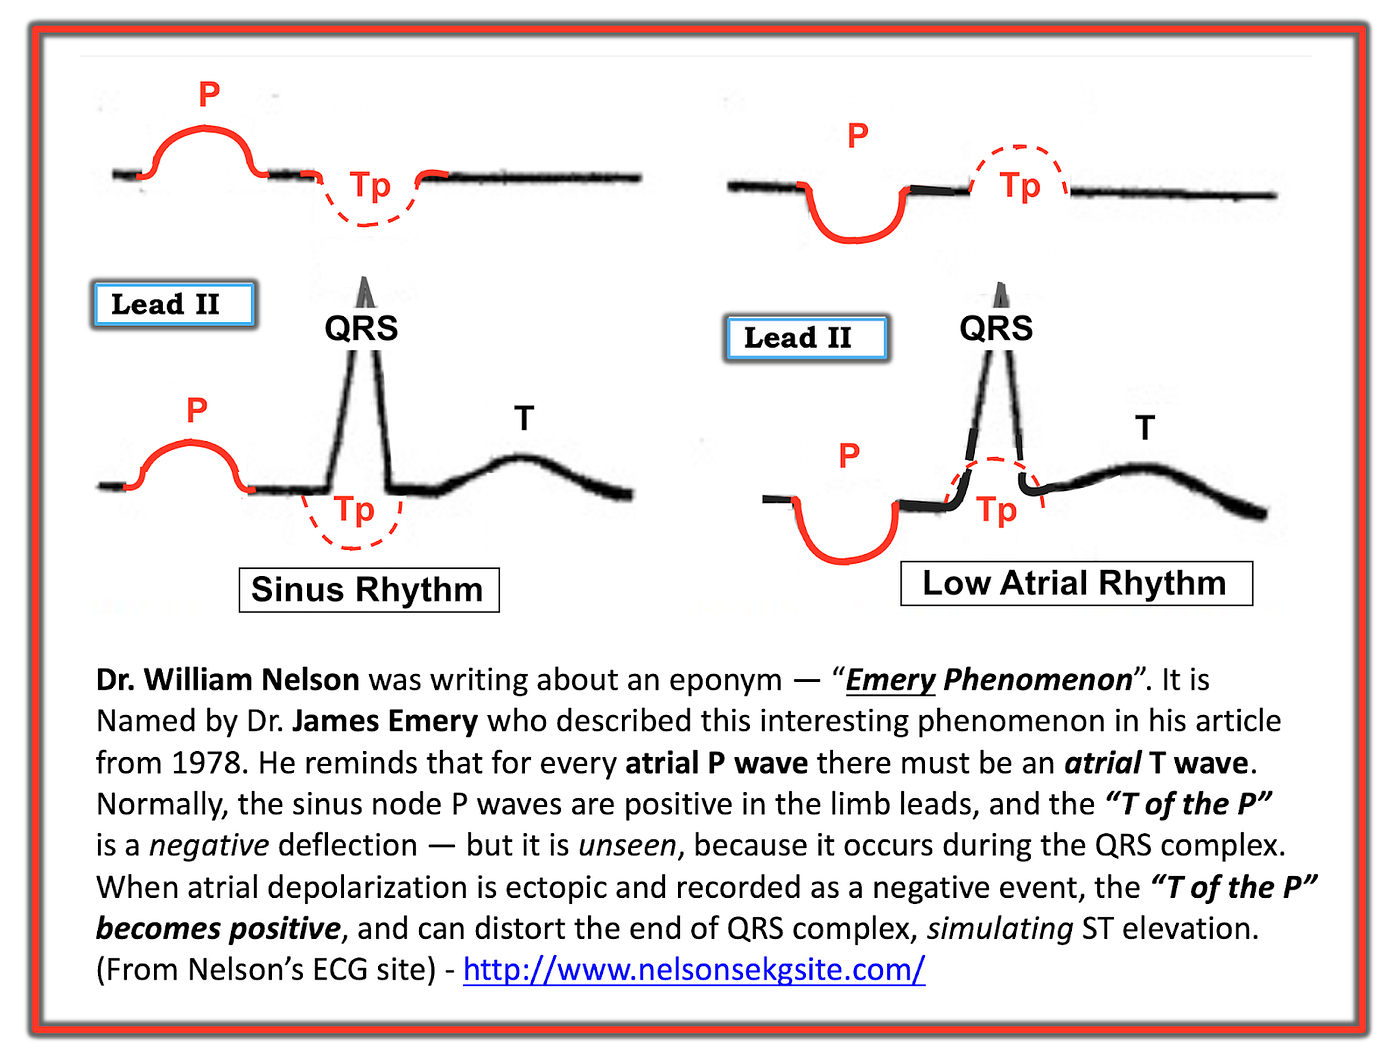
What the figure shows:
- (Left) Normal sinus rhythm: the P wave in lead II is Upright, so the P wave's repolarization wave (Tp wave) is inverted (it's hidden inside the QRS, so you can't see it).
- (Right) Ectopic rhythm, close to the low atrium, so this P wave sits close to the QRS and is inverted, but its Tp wave is Upright. That lifts the ST and makes it look like STEMI. See Lead II/Lead III in the figure below (Inverted P wave) combined with STE¹
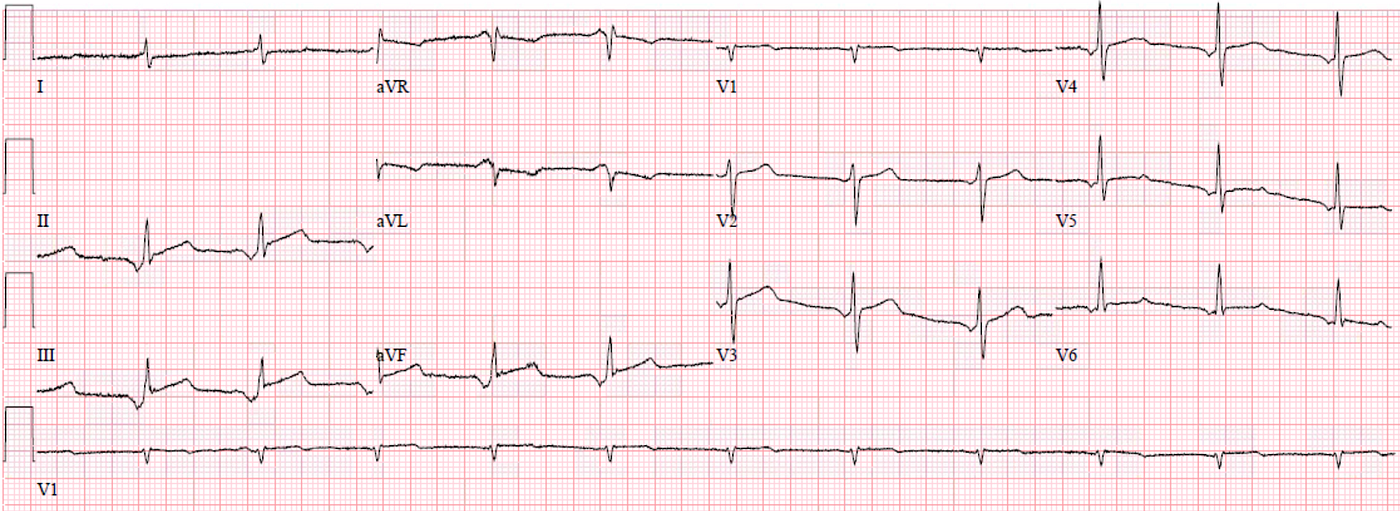
Tips: Watch out, the Tp wave can cause pseudo-STE, but it's generally mild. When the P wave isn't tall and the PR isn't short ➡ don't just blame the STE on the Tp wave (still think MI first)
If a lead is placed over an arterial pulse, that can also produce an STE appearance
Tips: Usually not every lead is affected, e.g. the Inf. leads (not all three will be affected)
Step 2: Rule out STE caused by conduction abnormalities
Is the QRS wide? If it is, consider whether the STE comes from a conduction abnormality.
Conduction abnormalities cause Secondary STE. You can take a look at this article I wrote before 3 .
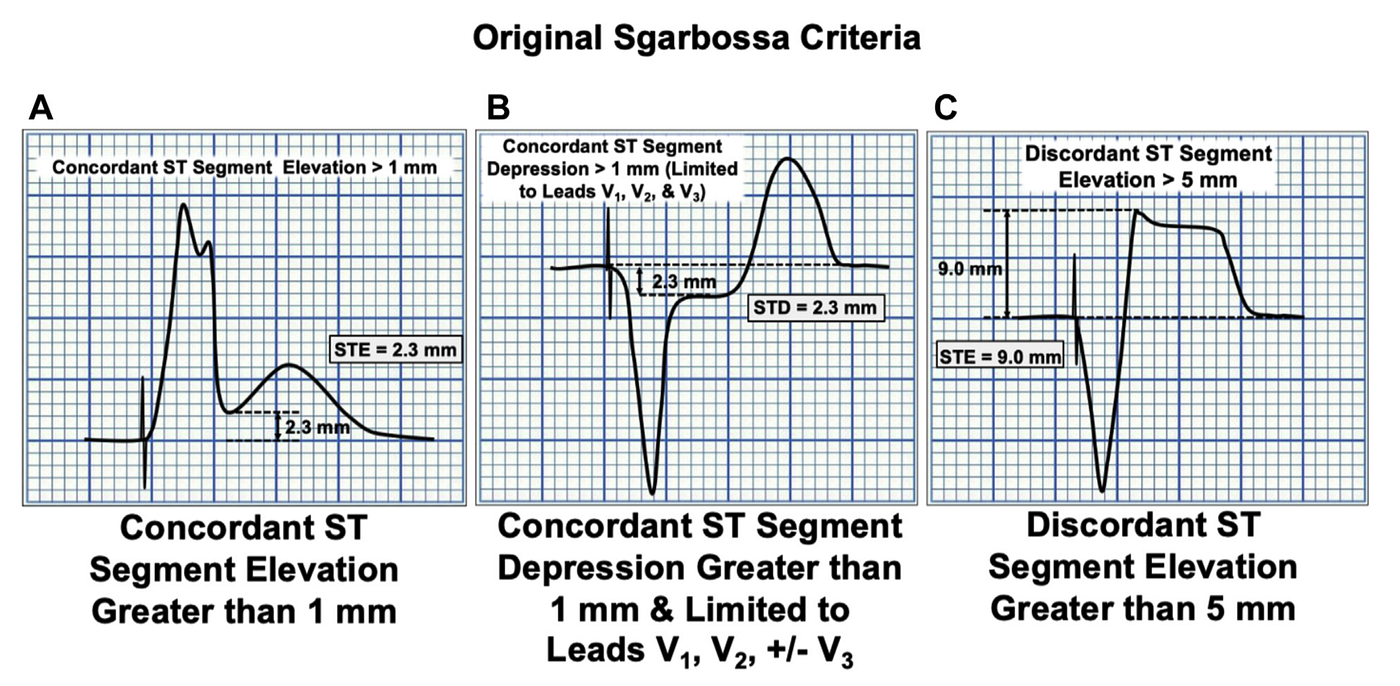
In LBBB patients the ECG should follow the ST Opposition Rule and appropriate discordance.
Tips: You can use the Modified Sgarbossa criteria (MSC): if there's concordant STE (in any lead) > 1mm (be careful even at just 0.5 mm) or concordant STD > 1 mm in V1~V3 → that counts as ischemia. Also, if STE/S > 0.25, be highly suspicious of ischemia (Fig 2)
In PPM patients you can also use the MSC to assess for ischemia, except when applying it, note that the original concordant STD > 1 mm in V1-V3 can be extended to V1-V6.
Tips: For ischemia in PPM patients, the MSC can also be applied
In RBBB patients, diagnosing ischemia is relatively easier than in LBBB/PPM. Also, RBBB occasionally shows discordant STD in V1~V3.
- If you run into RBBB (normal STD in V1~V3) + Post.OMI (Max STD over V2~V4), how do you pick it out? If there's excessive discordant STD (usually > 1 mm), consider OMI.
- RVH with strain can also give this pattern (STD/TWI over R't precordial leads, Tall R in V1) → you can still use the MSC: STD/R > 0.3 suggests ischemia
Tips: In RBBB there should be no STE in any lead
Remember to find a lead where the QRS is easy to measure, and carry that correct QRS width over to the lead with the suspected STE
Hyper-K also commonly shows STE, especially in the rightward leads (including V1~V2, aVR, III). Sometimes it looks like a Brugada pattern.
Tips: RAD + Rightward leads STE → put PE, Hyper-K, and Na channel blockers on the DDx
WPW syndrome can also show STE. If you see a delta wave, it's more likely secondary rather than caused by primary ischemia.
Step 3: Rule out other causes of secondary STE
If the QRS isn't wide but the amplitude is abnormal (this may affect both depolarization and repolarization)
LVH patients. First, get familiar with the LVH ECG voltage criteria.
My own way of remembering them is the method from the master, Ken Grauer:
Remember two numbers, 12 and 35:
S in V1 or V2 + R in V5 or V6 > 35 and/or R in aVL > 12
Age > 35 years
LV strain is present on the ECG
Using the 12 and 35 numbers catches about 90% of LVH; the other criteria catch the remaining 10%
So what are the remaining criteria?
I split them into two groups: single-lead / summed-lead (meeting any one should raise suspicion)(Fig 3)

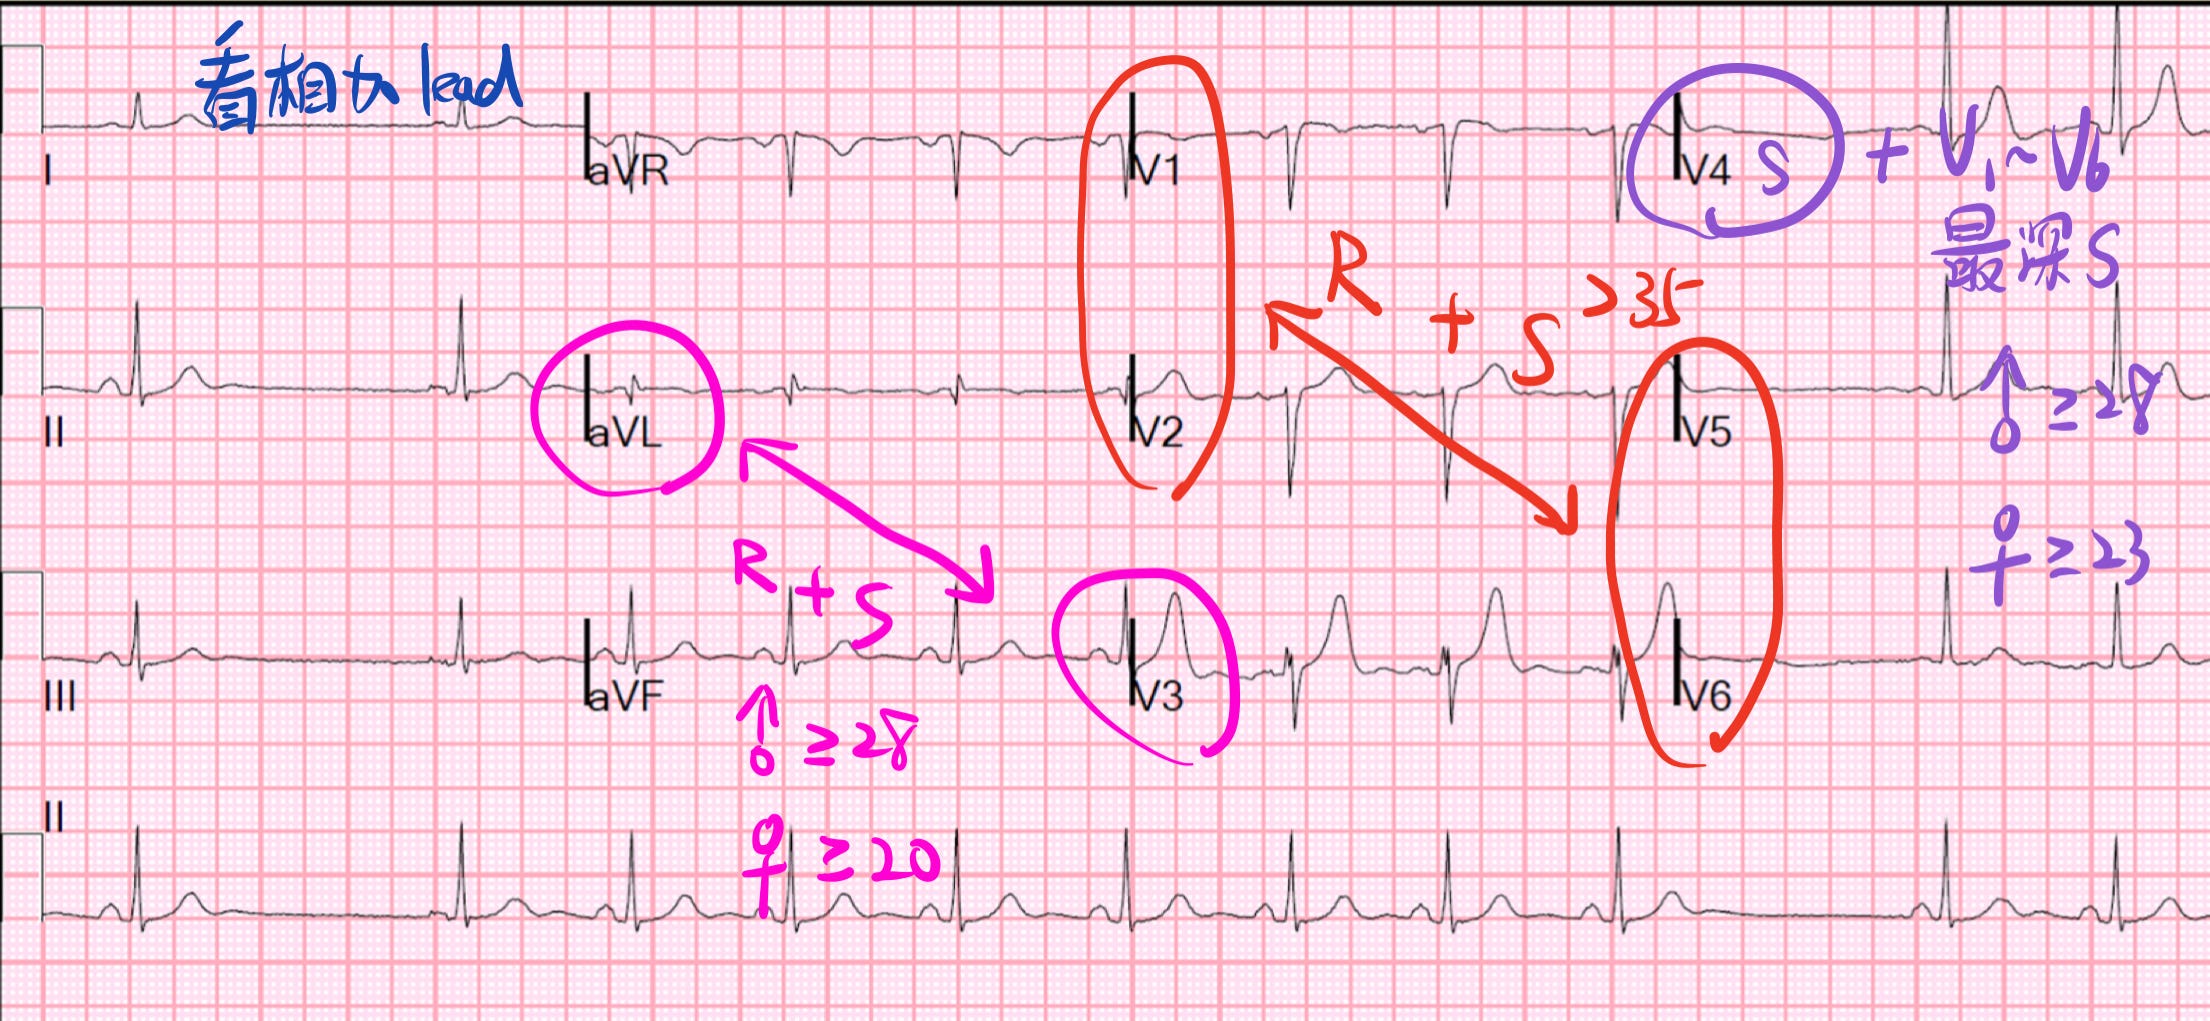
- LVH usually has STE in the leads with deep S waves (usually V1~V3), which can look a bit like STEMI.
- If the STE/S in these leads is > 1/6, consider OMI. I had never seen Dr. Smith describe this number, so I emailed the author to ask where it came from. The author said there's currently no paper backing it. The main reason is that AMI lowers QRS amplitude, so it isn't easy to find patients who meet both LVH and AMI.
- Also, a convex ST morphology can be seen in LVH too; it isn't exclusive to OMI.
- LVH also very commonly has STD in V5~V6 with reciprocal STE in aVR. This looks a lot like ACS, but it's the common LVH with strain pattern.
- LVH with high voltage in the limb leads can also cause nonischemic inf.STE with reciprocal STD in aVL (note here: does STD or TWI in aVL always mean an early ischemic sign? → LBBB/LVH need to be ruled out)
- That said, Amal Mattu's teaching in the 2021/2/1 ECG Weekly mentioned a paper 4 .
- Fig 4 below is the chart from that paper.
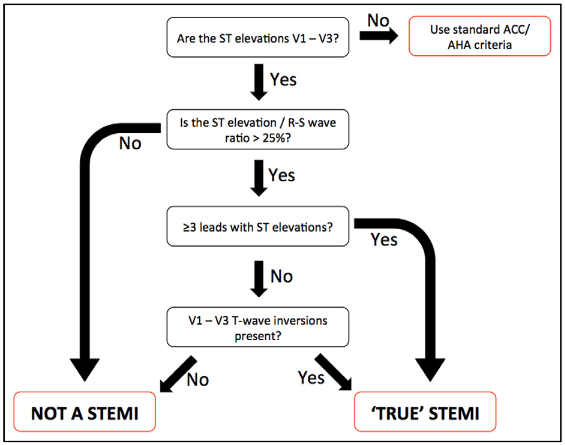
Premise: the ECG must meet LVH voltage criteria
- First, check whether V1~V3 all have STE
- In those V1~V3, is STE/R+S > 0.25 (similar to the excessive discordance concept)
- Are there ≥ 3 contiguous leads with STE?
- 1~3 all Yes → STEMI
- If 3 is No, is there TWI in V1~V3? If Yes → STEMI
Tips: This flowchart only works for LVH + ant.wall STEMI; it can't assess other walls
Next, let's look at patients with an LV aneurysm. Most of these patients had a prior MI, which led to the aneurysm. And the aneurysm can also produce ST elevation.
Dr. Smith has written a great many posts on how to tell LV aneurysm from OMI. If you have time, check out this one 5 . I've written the key points below:
First, who should be considered suspects:
- First, there has to be STE + well formed Q waves (especially QS waves in V1~V4, at least one)
- Second, the ECG DDx has to be LV aneurysm vs. acute STEMI
Which rule to use?
- If any lead in V1~V4 has T/QRS > 0.36 ➡ you have to consider acute STEMI, and of course subacute STEMI is also possible (use when the DDx is LV aneurysm vs. STEMI)
Note: If the pain has lasted more than 6 hours, the patient may be a subacute STEMI. When you apply T/QRS after that much time, the T wave may no longer be as tall and wide, so it gets classified as LV aneurysm, causing a false-negative
Tips: When T/QRS > 0.36 + clinical picture (chest discomfort) ➡ activate the Cath lab
If you don't know the formula, you can also compare serial ECGs. If there's a dynamic ECG change, a STEMI will show ECG changes. Also, the following features lean toward LV aneurysm
- well formed Q-waves (deep QS waves)
- no big, tall T waves
- no reciprocal change or ECG dynamic change
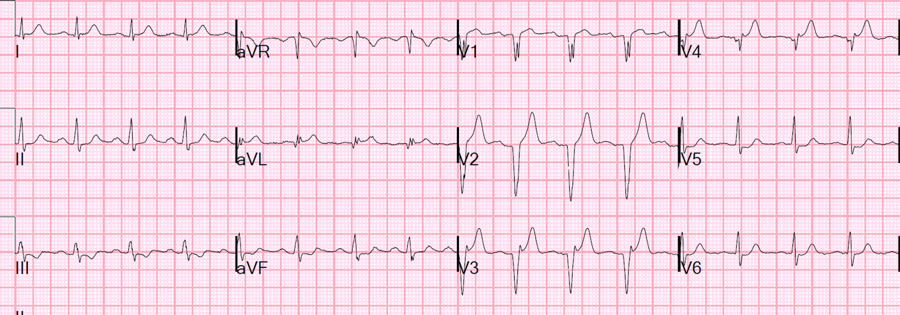
Let's look at an example!!! (Fig 5) 6
You can see QS waves in V1~V4. T/QRS > 0.36 in V2~V4 → Favor STEMI
Step 4: Rule out other causes of primary STE
When the QRS complex is normal (normal duration, normal amplitude) → next, look at where the STE is maximal and how it's distributed.
When STE is widespread, consider pericarditis. Pericarditis is far rarer than OMI, yet it's still overdiagnosed.
Tips: Be very careful about diagnosing pericarditis, because pericarditis is rare, and if you diagnose pericarditis (not including myocarditis or pericarditis with PEF), it only needs NSAIDs or Colchicine. But if you get it wrong and call an AMI pericarditis, you put the patient in danger. (Never diagnose 99 pericarditis and miss 1 AMI)
— Pendell Meyers even treats pericarditis as a wastebasket diagnosis
— Pericarditis isn't important under any circumstances (premise: no concurrent myocarditis or PEF)
1So if the diagnosis is down to STEMI vs. Pericarditis, how do you pick out the STEMI?
Here I'm using the three-step diagnostic workflow from the master, Amal Mattu. It's clearer and more organized.
Step one: if any of the following are present, favor STEMI (go in order: if 1 is present → straight to Call for PCI; if not, move down the list → and so on)
- STD in any lead other than aVR and V1 (meaning there's an MI producing reciprocal change)
- STE in III > II
- Look at the STE morphology (any convex STE, horizontal STE, R-T sign → Favor AMI). If you see a Hyperacute T wave (the QRS fits inside the T wave), that's also an Early STEMI sign; pericarditis doesn't do this. STE > 5 mm also leans toward STEMI
- New Q waves (a new Q wave suggests possible STEMI ECG evolution change) (Fig. 6)
Step two: if any of the following are present, favor pericarditis
- PR depression in multiple leads (PR depression → Not specific for pericarditis)
- 12% of STEMIs have PR depression → Atrial infarction/ischemia/repolarization can all produce PR depression (never assume pericarditis just because you see PR depression)
- Marked PR depression in multiple leads (Only reliably seen in viral acute pericarditis → usually short-lived). PR depression is very common in ordinary situations, but if it's > 0.8 mm, suspect pericarditis, especially if you see it in both limb & precordial leads.
Step three: Spodick’s sign: downsloping of the TP segment (premise: only look at this after assessing with Step 1 & 2 → if (+) → Favor pericarditis). Note that 5% of STEMIs have Spodick sign
Tips: Use Amal Mattu's three steps to distinguish STEMI vs. Pericarditis
1So if the STE makes you suspect Early repolarization (ER) or STEMI, how do you tell them apart?
First, the incidence of Early repolarization is about 2~31%
- It can cause inf. and lateral STE, so it often causes false-positive Cath lab activation
- A J wave is common in ER, but it can also be present in OMI.
So let's see how to tell them apart!!! Here I'm again using the five-point method Amal Mattu teaches → STEMI vs. Early repolarization (Fig. 7)
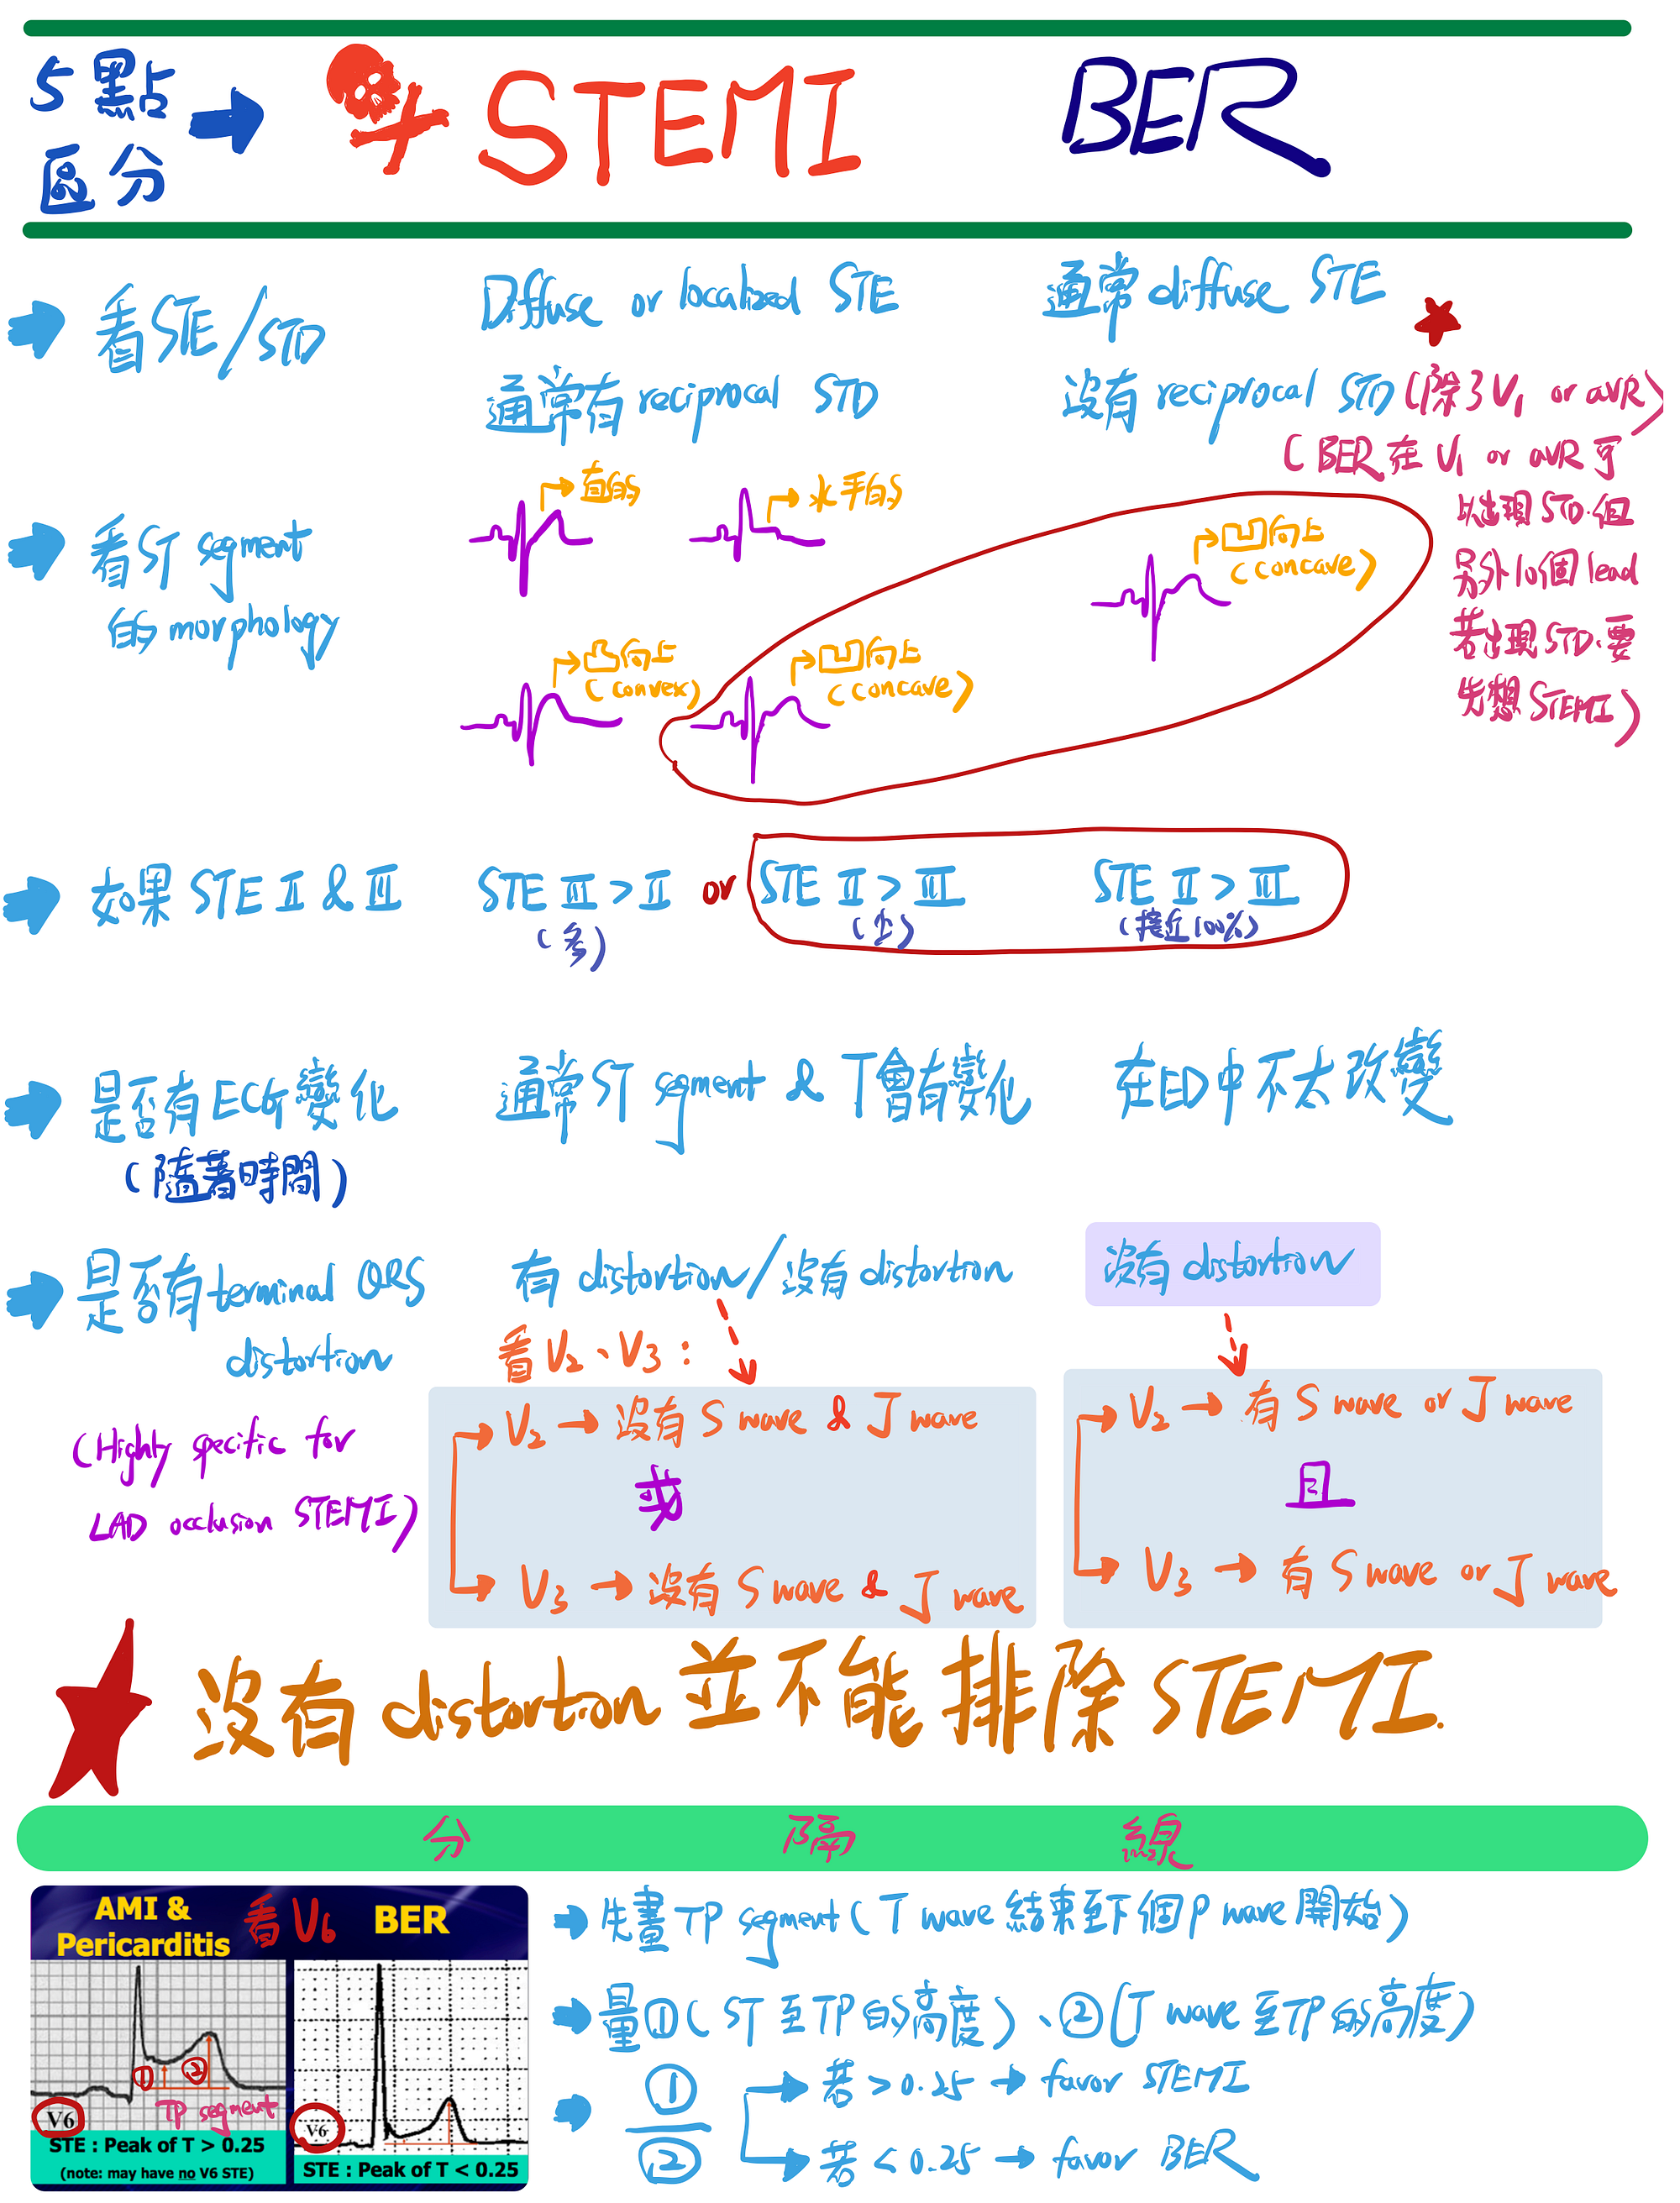
Tips: Note here: seeing TQRSD can rule in AMI, but not seeing it can't rule it out
Also, Brugada syndrome, Na channel blockers, and Massive PE can all produce rightward-lead STE, so differentiate carefully.
Tips: If RAD + Rightward leads STE → first consider Hyper-K, Pulmonary embolism, Na channel blocker as the cause; don't think AMI first (AMI is less likely to show RAD)
Step 5: STE combined with TWI
When a patient has spontaneous reperfusion (opened up on its own) and symptoms have resolved, STE can still be seen. At this point you can see STE with TWI. This is Reperfusion evolution. It means there definitely was an OMI; otherwise the reperfusion T wave changes wouldn't appear.
- These ECG changes matter more than how long the chest pain lasted

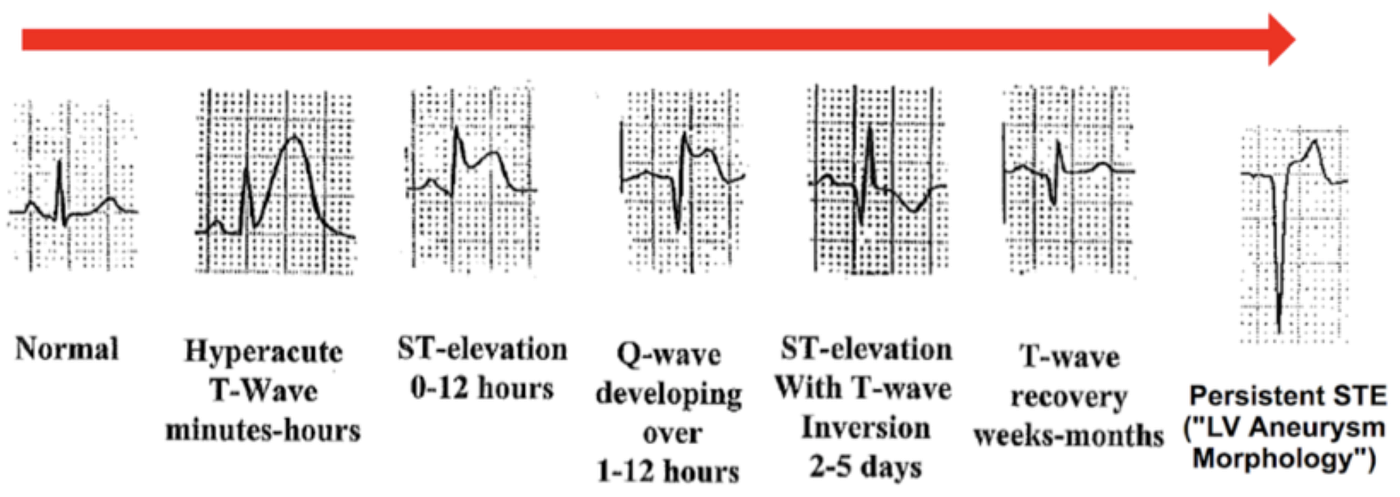
Fig. 8 above comes from Smith ECG's OMI teaching images; this figure is used all the time. It lays out the following basic AMI knowledge:
- If the patient has ACO (acute coronary occlusion), these are the ECG changes over time. Very early in the occlusion it's almost normal, then Hyperacute T waves (HATW) appear, then the ST starts to rise into obvious STE. Then Q waves appear. Later TWI appears, and after weeks to months the T wave returns to its original shape.
- If the patient has spontaneous reperfusion or gets PCI/rTPA before Q waves appear, they enter reperfusion evolution. You'll then see Terminal TWI (i.e. biphasic TWI → what we usually call Wellens type A), which later progresses to Deeply TWI (Wellens type B). And of course, if Q waves have already appeared and the artery is opened by PCI later, you'll also see the reperfusion T waves described above.
Tips: Wellens’ T waves represent reperfusion T waves and can appear in any lead (on an ECG done while asymptomatic). But when we say "Wellens’ syndrome," we specifically mean spontaneous reperfusion of the LAD before infarction/necrosis, with Terminal TWI or Deeply TWI in the V2~V3 it supplies (asymptomatic at the time of the 12 lead ECG)
Why the Q wave and T wave matter
- A larger T wave with no visible Q wave, or a small Q wave and no QS wave (a QS wave means the infarct is already complete; you can look at the LV aneurysm section above) → usually means highly acute
- A smaller T wave, shallower TWI, or a fully formed Q wave ➡ usually suggests it isn't that acute
- QS waves with shallow TWI are a typical completed MI
- A fully formed Q wave with shallow TWI suggests a completed MI ➡ whether urgent Cath lab activation is needed is still unsettled
- Deep, symmetric TWI means reperfusion; clinically it means there's still a lot of viable myocardium. (usually preserved R waves)
Tips: A Large T wave, whether Upright or Inverted, means there's still a lot of viable myocardium (Upright → it's occluding right now, but there are still many living cells → get to PCI fast; Inverted → it's reperfusing now, and there are many surviving cells at the moment)
The Wellens’ syndrome concept
- Look for Terminal TWI (Wellens’ pattern A) or Deeply TWI (Wellens’ pattern B): usually A evolves into B
- Clearly preserved R waves suggest an unstable thrombotic lesion is still inside the coronary artery, but it has spontaneously reperfused for now
- With prior chest pain that has resolved by the time of the ECG, Wellens’ waves in V2~V3 ➡ are called Wellens’ syndrome ➡ this syndrome is just the LAD and ant. wall version of the phenomenon. The same phenomenon can occur in other coronary a. territories and their corresponding leads.
- These patients need urgent but not emergent Cath lab activation
- Until the CAG, monitor carefully for recurrence of chest pain, new STE, or Pseudonormalization of T waves ➡ these suggest re-occlusion
Tips: Being asymptomatic with Wellens’ T waves doesn't mean the vessel has fully opened on its own. There's still an unstable thrombus in the vessel that just hasn't occluded it yet, so it needs even closer monitoring. If the T waves suddenly normalize and the chest pain comes back → it has occluded again
When there is no obvious STE
Step 6: Get to know the special pattern of STE in only one lead
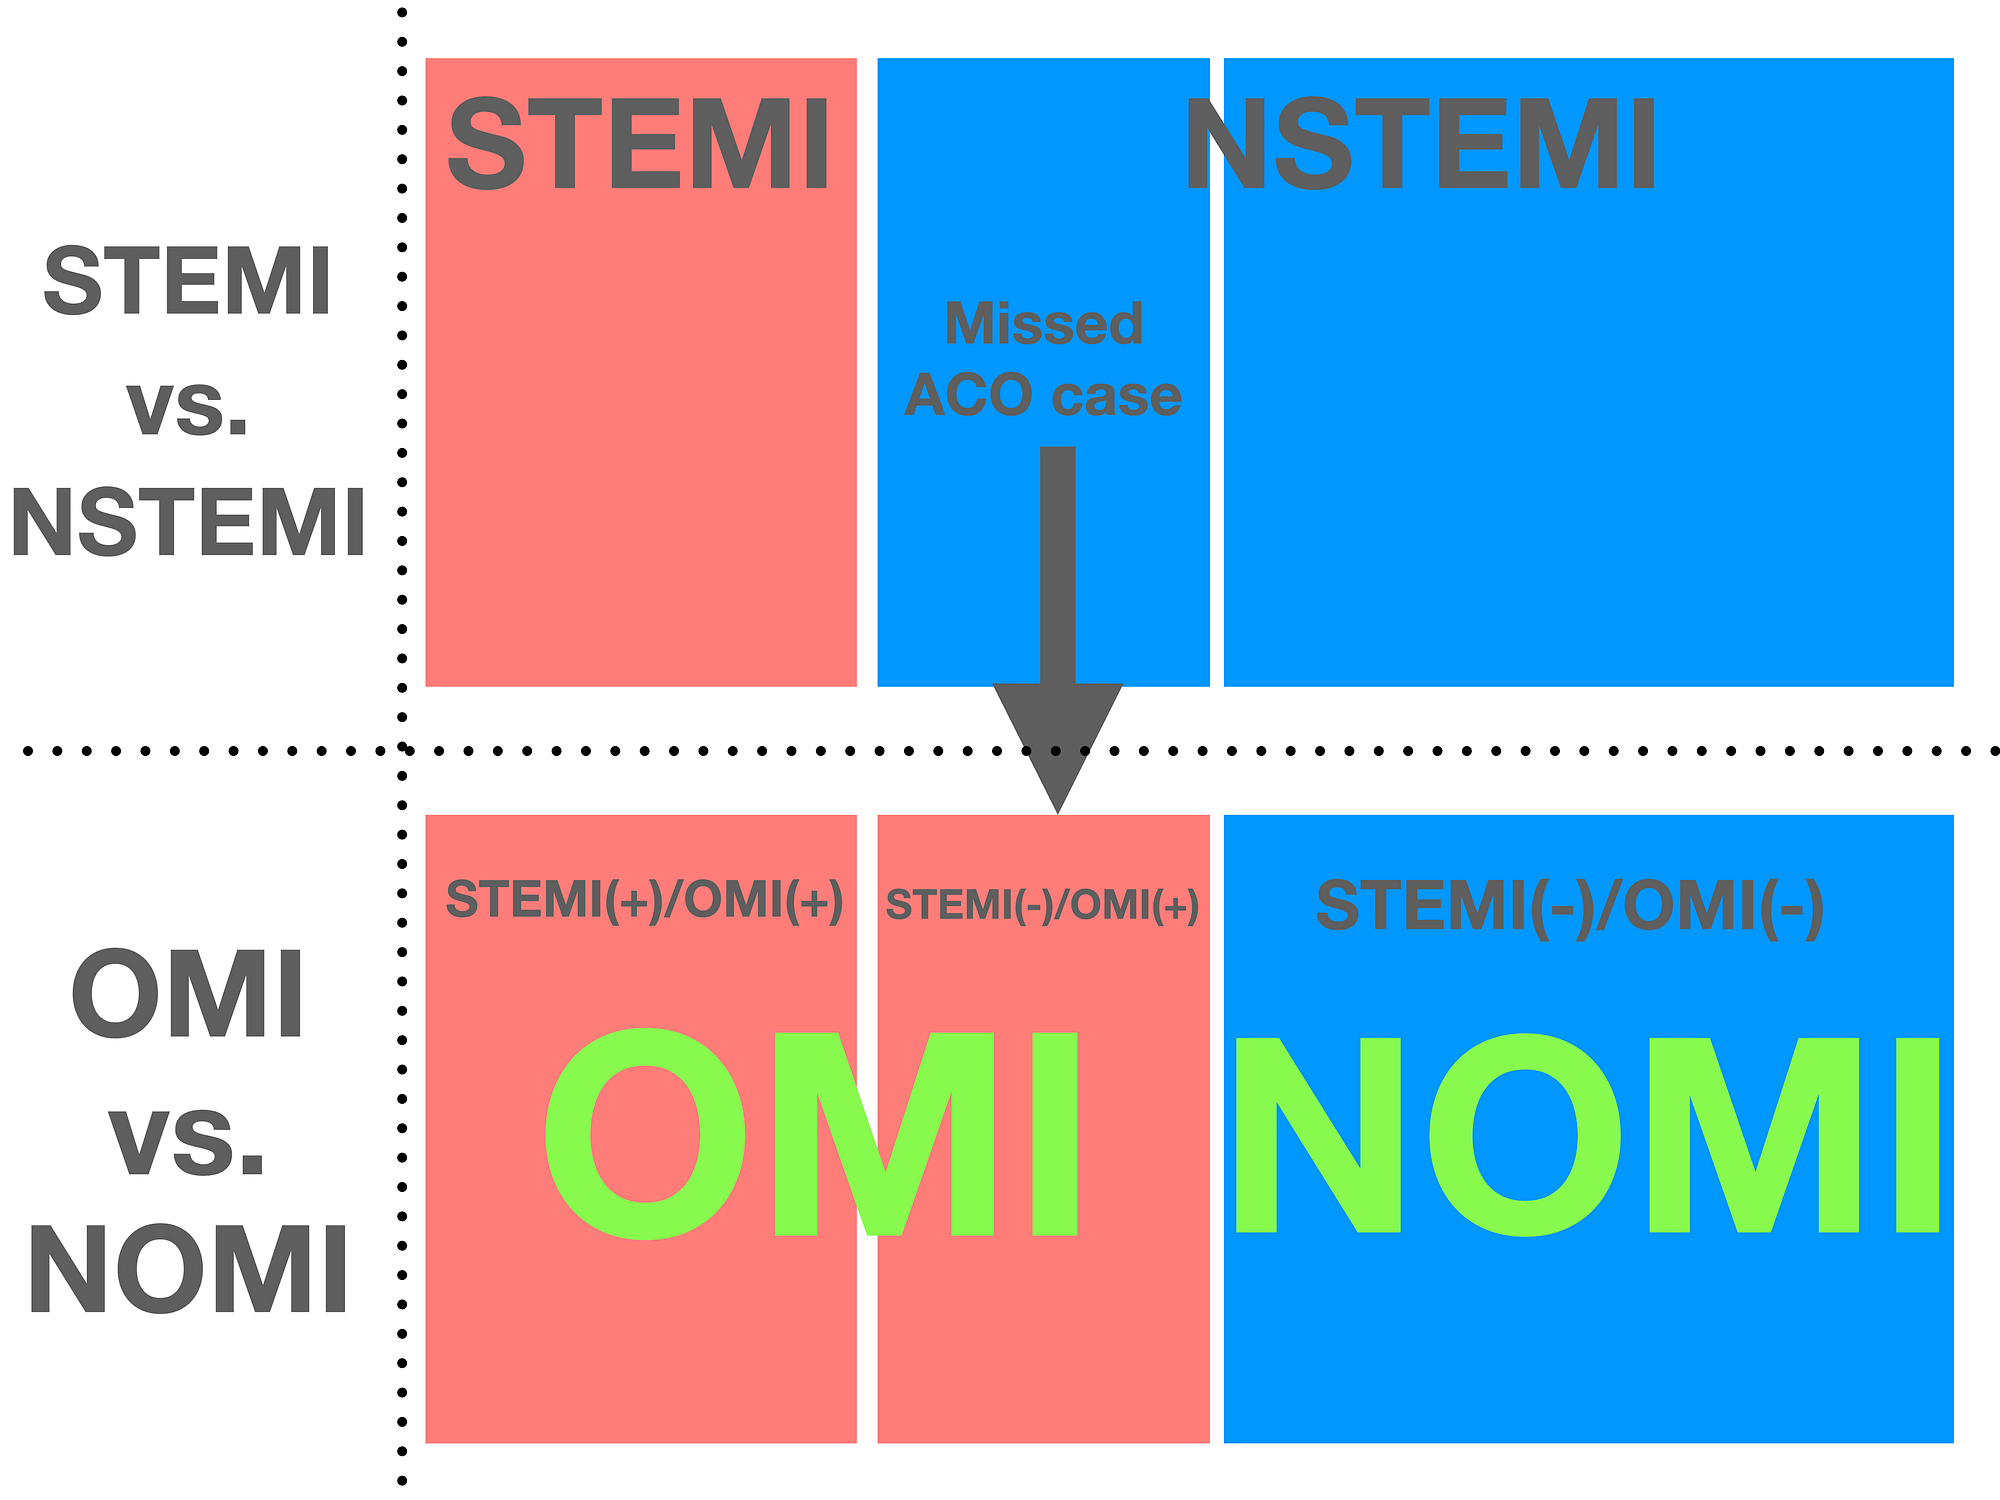
First, let's recall the definition of the STEMI criteria → STE in at least two contiguous leads is required. Later it turned out that a lot of OMIs don't meet STEMI criteria. These patients who didn't meet STEMI criteria got lumped into NSTEMI. Only after PCI did we find the artery was occluded. These ACO cases we missed are STEMI(-)/OMI(+). Statistics show they make up roughly 25%~30% (Fig. 9).
And among these STEMI(-)/OMI(+) patients, some have STE in only a single lead / or STE in non-contiguous leads, yet PCI eventually found an occluded artery.
First, Aslanger’s pattern: suggests inferior OMI with multi vessel disease
- This pattern comes from a paper by an interventional cardiologist, Aslanger Emre 7
- 13.3% of inferior OMIs have this pattern
- 6.3% of NonSTEMI patients have this pattern ➡ compared with patients with true Inf.wall STEMI, they have larger infarct size and higher mortality
- 0.5% of ordinary people without AMI have this pattern
Definition of Aslanger’s pattern:
- STE in Lead III only among the inferior leads, with reciprocal STD in aVL
- STD in any of leads V4-V6 with upright or terminally positive T wave (no STD in V2)
- ST in V1 higher than in V2
Let's look at an example (Fig. 10) 8
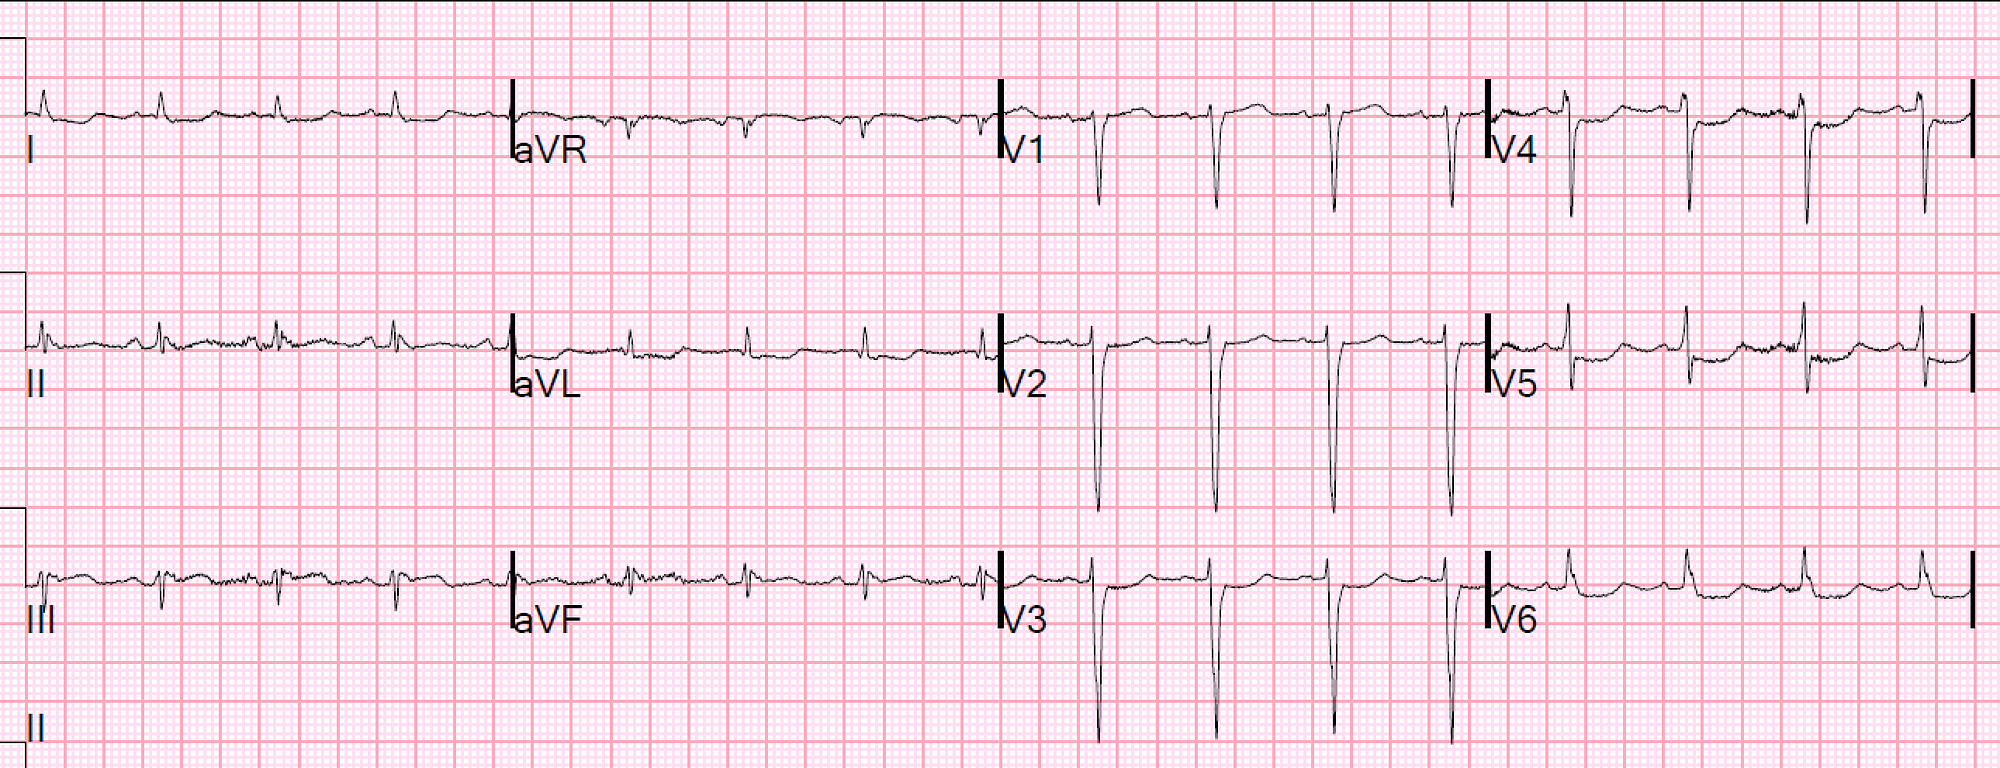
Lead III has STE with reciprocal STD in aVL, STD over V3~V6, ST in V1 > V2 → this ECG meets Aslanger’s pattern → subsequent PCI found Severe CAD with TVD, LCx 100%
Tips1: Remember Aslanger’s pattern: even if the STE in lead III is < 1mm with reciprocal change in aVL, in the right clinical context it still helps diagnose OMI
Tips2: Clinically, when multiple vessels are occluded, deciding quickly which one is the main problem vessel isn't easy, and delaying PCI may worsen the prognosis. But if the ECG shows Aslanger’s pattern, you know the vessel supplying the inferior wall is the true Culprit lesion, and the other occluded vessels may be supporting actors. So treating the vessel supplying the inferior wall (RCA or LCx) first is the best move.
Next, the South African flag sign. Let's look at a figure first (Fig.11)
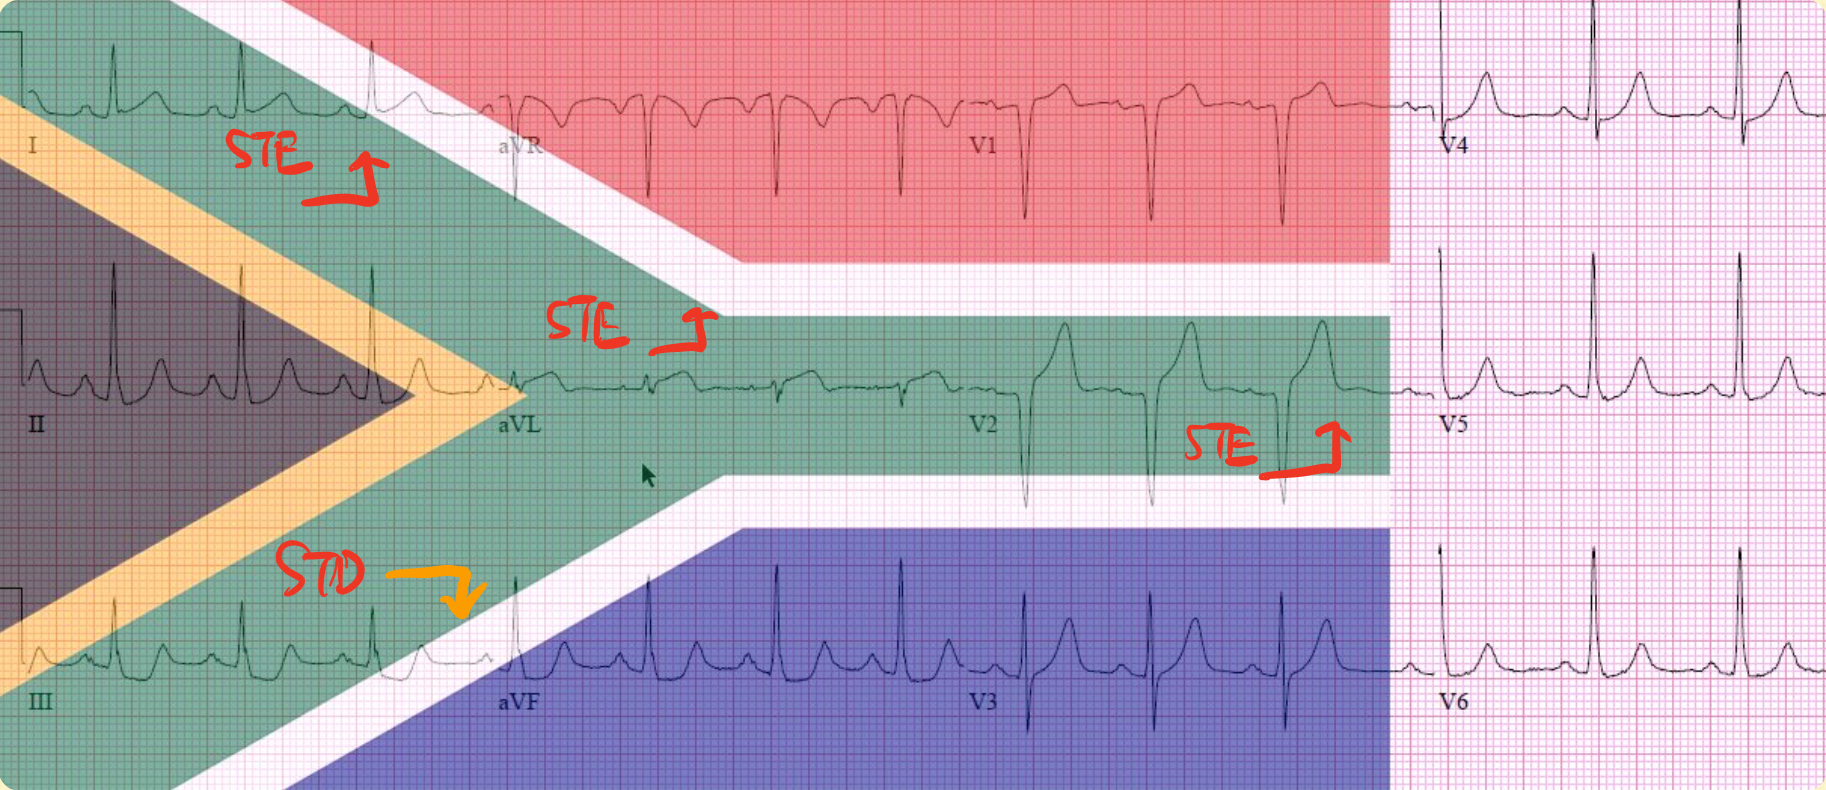
Like Aslanger’s pattern, the South African Flag sign is a real rebel that breaks the STEMI criteria rules, yet it truly does represent OMI. Its STE isn't in contiguous leads.
The South African Flag sign ECG pattern has to meet the following:
- STE over ±Lead I/aVL/V2
- STD over Lead III (inf.leads)
Tips: If you don't see STE, other occlusion signs also count:
- New Q wave
- Non-concave ST segment
- HATW (Hyperacute T wave)
- Reperfusion T wave
The ST current of injury vector of the South African Flag sign points up and to the left, which suggests a High lateral OMI → suspect LAD-D1 occlusion
Putting these two special ECG patterns together, let's look at the direction of each one's ST current of injury vector.
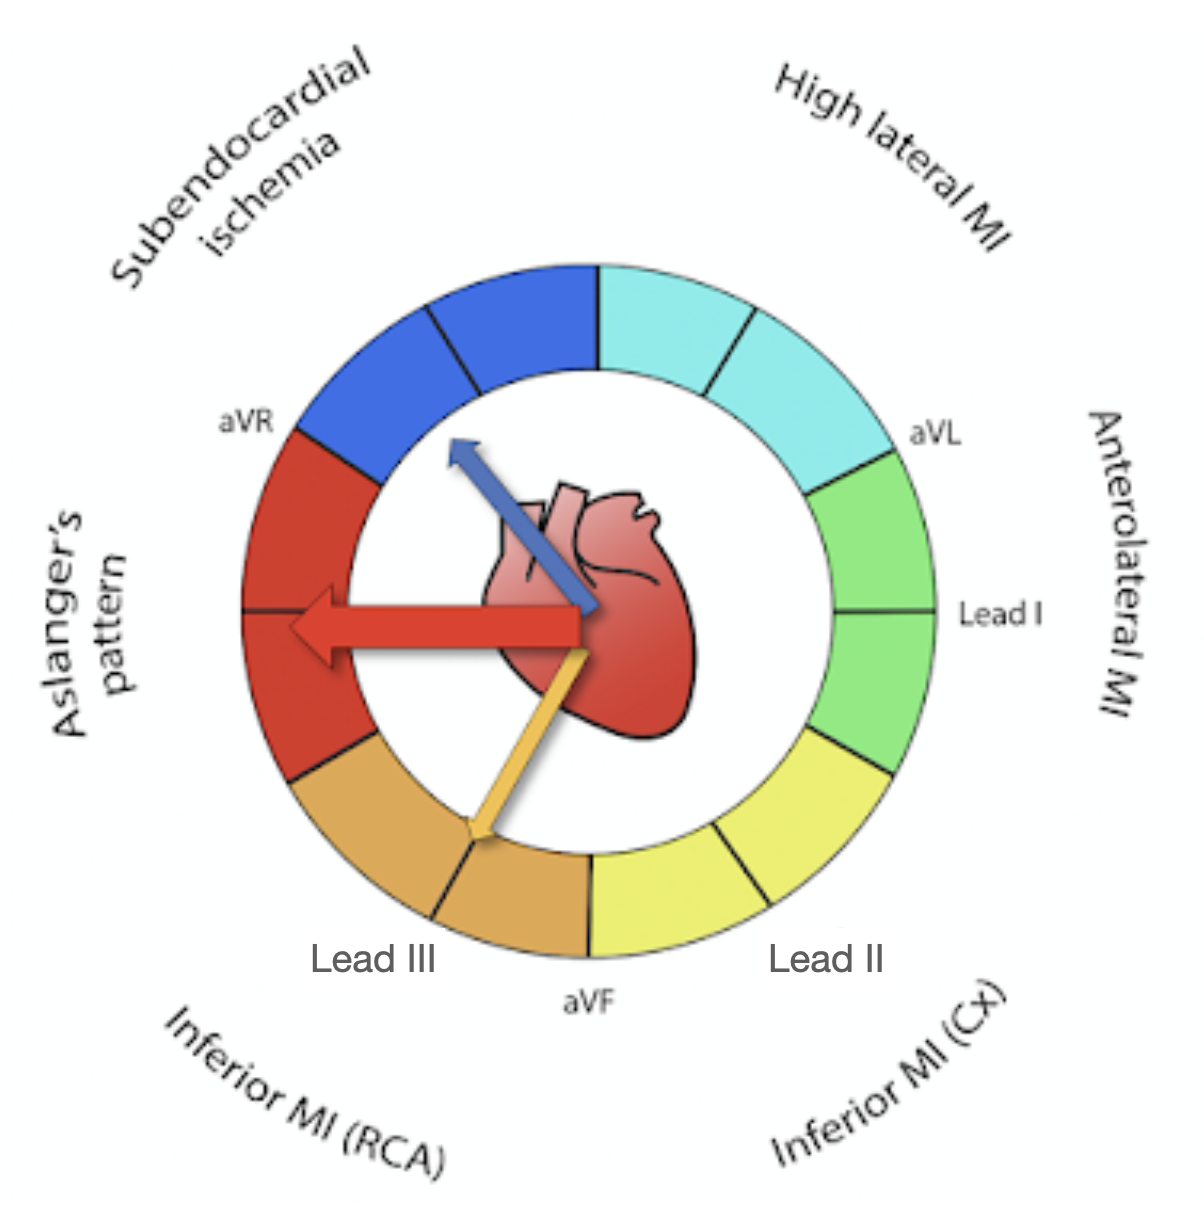
- Fig.12 is Aslanger’s pattern. The definition requires STD in V4~V6, i.e. subendocardial ischemia, so the ST direction is up and to the right (blue), and the definition also requires STE in lead III (yellow), so the combined vector of the two is +180 degrees. The ST current of injury points toward the inferior wall.
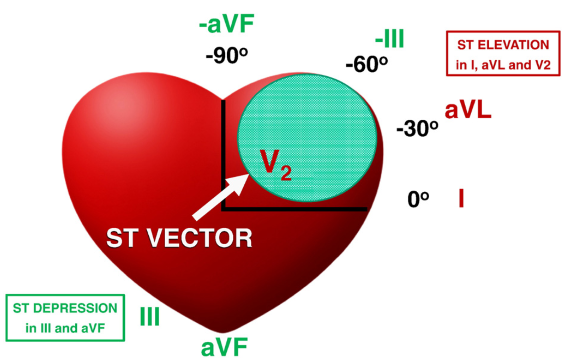
- Fig.13 represents the South African Flag sign. Because aVL and V2 need STE and Lead III needs STD (so the STE direction is the opposite side - up and to the left), the ST current of injury vectors of both point up and to the left (white), which suggests a High lateral OMI → suspect LAD-D1 occlusion
Step 7: Describe the ECG in detail to find subtle STE
This step is fairly scattered in the article's text, so I've tried my best to write it up clearly.
- One limitation of the STEMI criteria is that they strip out the relationship with the QRS. Repolarization and depolarization are always proportionally related. So in LVH with very high voltage the STE will be high, and with low QRS voltage the STE will be lower.
- In a patient with normal STE, the QRS morphology differs from that of ischemic STE. Normal STE has taller R waves and QRS amplitude.
- If the T wave is wide and large, you have to consider that this is ischemic STE. Without that kind of T wave, there's usually no ischemia.
- Mild QT prolongation is also one of the signs of ischemia.
Tips: Putting all that together, any STE should be read together with the QRST
Of the missed OMIs, 3/4 could actually have been recognized from subtle STE in hindsight
- Most of the missed STE is characterized by low amplitude QRS with proportionally larger T waves, which are easy to miss
- Sometimes the easiest ECG feature to recognize is the reciprocal change; when you see it, go look right away for STE in the corresponding leads
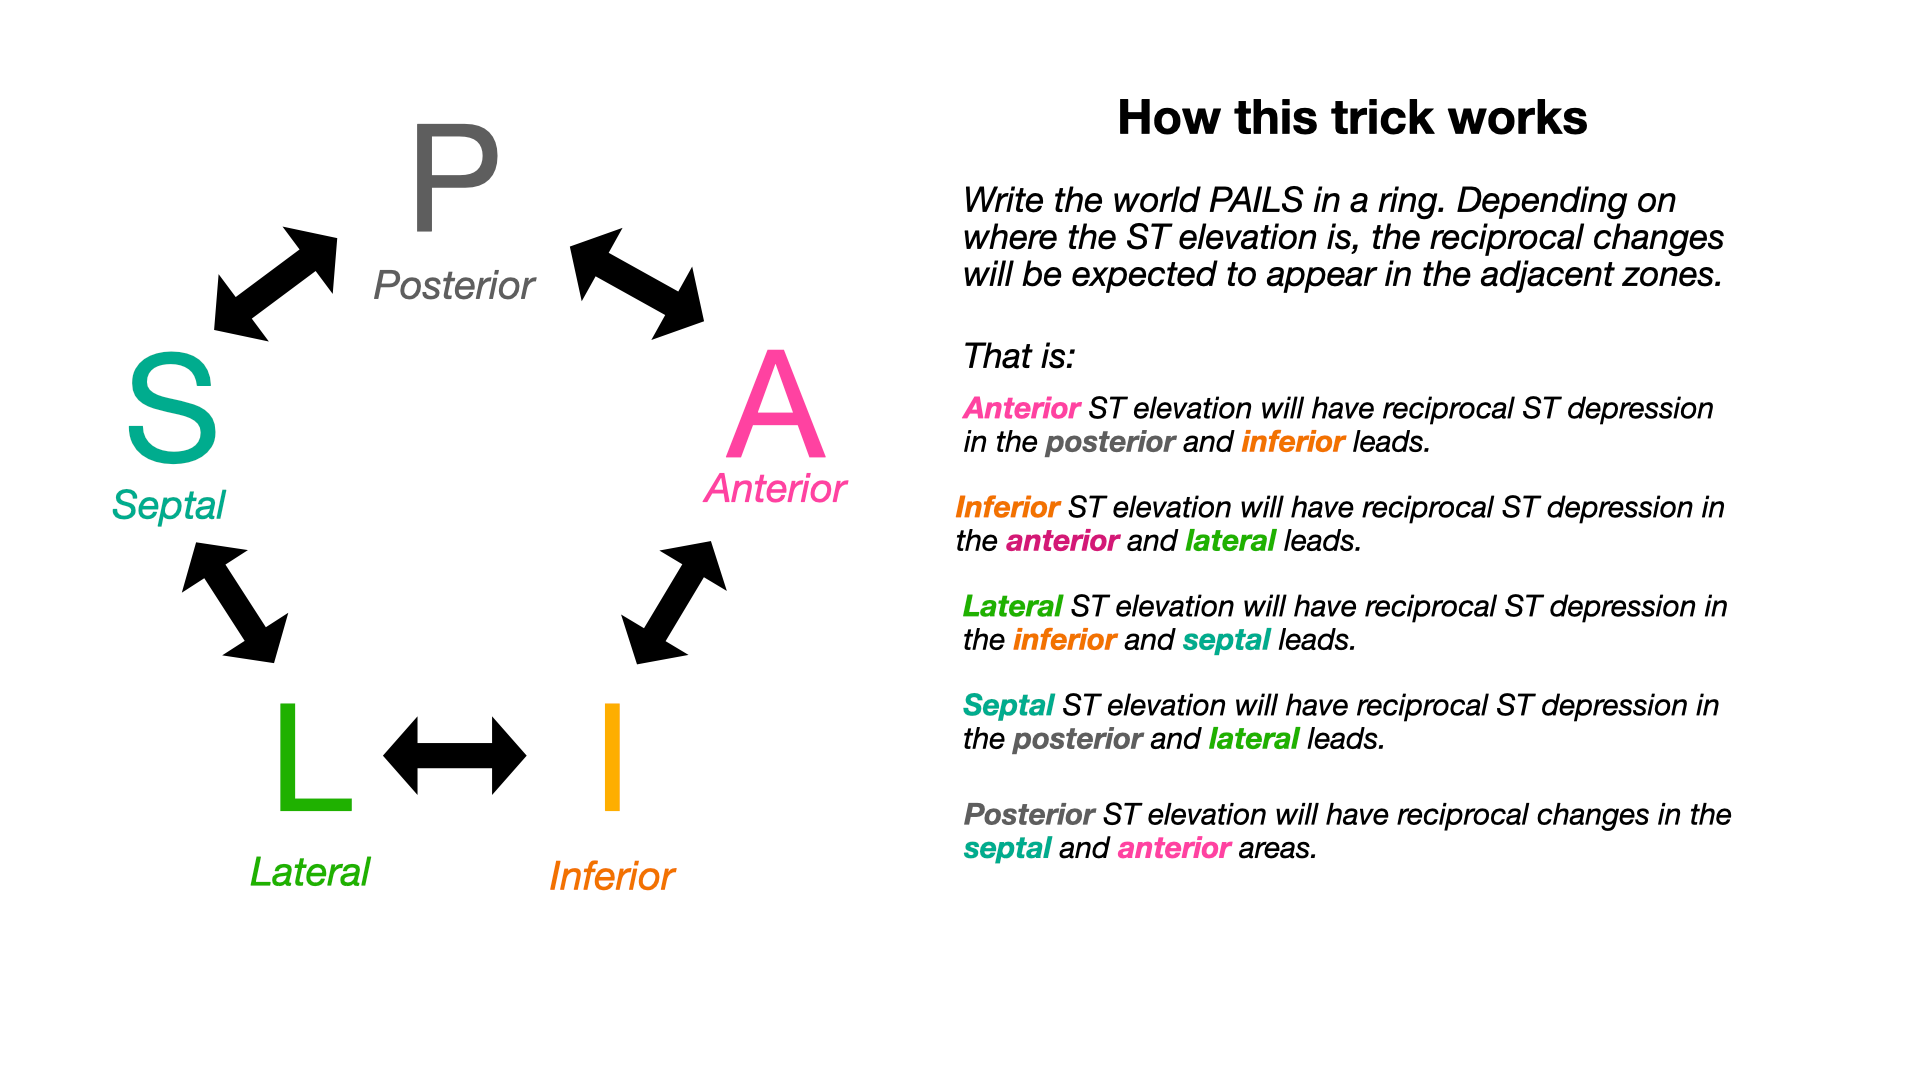
To learn to recognize reciprocal change, use this chart (Fig.14); it's very useful. Mnemonic: PAILS
Tips: Pay special attention: LBBB, LVH, WPW, inferior LV aneurysm, and PPM often have baseline reciprocal STD without ischemia.
Here the article proposes a nice approach: look at the inf.leads and aVL as one group, which usually have lower QRS amplitude
- First, check for any STE or large T wave in the inf.leads, especially lead III, then check aVL for any STD and TWI ➡ these signs all support suspecting an inferior OMI
- Next, check for any STD in the inf.leads ➡ this is a clue to LCx, D1, or LAD occlusion. If so, the STE in aVL is very small, or only the T wave in aVL is relatively large compared with the QRS. Or the inf.leads show TWI that's large relative to the QRS ➡ this is reciprocally hyperacute (because the reciprocal lead of aVL is Lead III, when Lead III shows TWI large relative to the QRS, even though aVL has minimal STE, you can infer aVL may be in trouble; this presentation is called reciprocally hyperacute)
Normal variant precordial STE (such as ER, LVH, etc.) does not come with precordial STD at the same time
- If you don't see any ST deviation (STE or STD) or Hyperacute T wave in the limb leads ➡ check for reciprocal STD in V5~V6. Early repolarization (ER) doesn't produce that kind of STD, so if there's any STE in the right precordial leads at that point, it strongly suggests anterior OMI → the earlier Fig.7 describes how to distinguish STEMI vs. ER
Tips: Dr. Smith has emphasized many times on his Blog: if you find STE and STD at the same time in the precordial leads → Favor an LAD problem (PAILS can explain this)
If an anterior OMI shows no reciprocal STD, diagnosing MI gets harder when there's STE in V2~V4. In the Guidelines, V2~V3 already have varying degrees of normal STE depending on sex and age. But that doesn't help much, mainly because ischemic STE usually doesn't go up
- Although upward convex or straight ST segment morphology is more specific for ischemic STE, close to 40% of anterior OMIs don't show that ST morphology.
- Normal STE almost always shows upward concave ST morphology in V2~V6
- If there's at least 1 mm of STE in V2~V4, you can apply the Smith 4 variable formula (MDCalc link below) to distinguish Early repolarization vs. anterior OMI. And if you don't want to calculate the QTc, you can apply the Simplified 4-variable formula 9 ➡ if <12, be highly suspicious of LAD OMI. When the Simplified formula result is borderline, use the original Smith formula.
Simplified 4-variable formula (no need to calculate QTc) (Fig.15): (RAV4 + QRSV2) — (QT interval mm + STEV360)
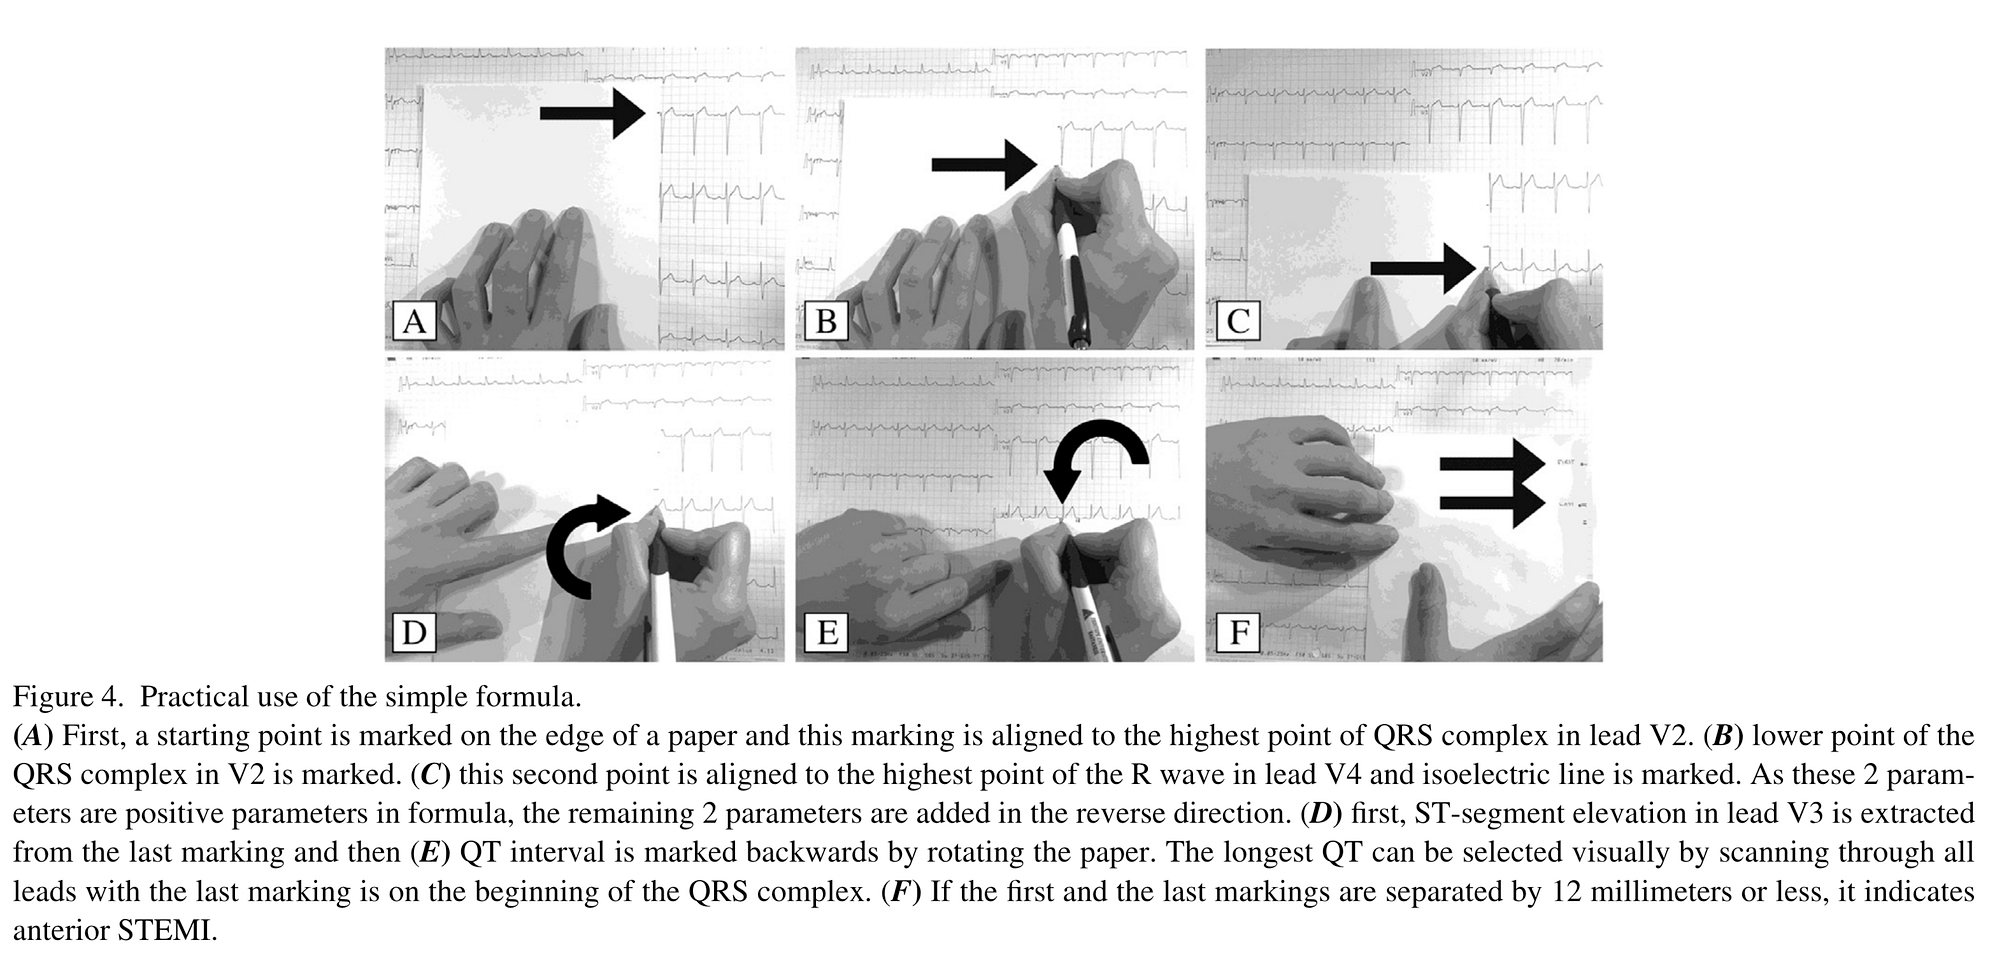

Tips1: The scenario for the Smith 4 variable formula is when you can't tell STEMI from ER, and the Fig.7 chart still doesn't sort it out; then run the formula. Once you've done it a few times you'll know QRSV2 (the whole QRS amplitude), STEV360 (the STE height 1.5 small boxes after the J point), RAV4 (the R wave amplitude in V4); then take the computer-measured QTc from the top of the ECG, plug them into MDCalc, and you get the probability of OMI. If you don't have a computer handy, you can download the MDCalc app for iOS or android. I keep it in the most visible spot when I open my phone so it's easy to use.
Tips2: Note: these formulas can give false-positives, e.g. low QRS from obesity, PEF, myocarditis, or an excessively long QT segment for any reason
Tips3: To sum up this step → look for low amplitude QRS, look for minimal reciprocal change, watch for any STD in the inf.leads, watch for STE or large T waves in the inf.leads with STD/TWI in aVL, and use the Smith 4 variable formula to diagnose subtle LAD occlusion
Step 8: If you really don't see STE, look for STD
If there's any inf.STD, look for Hyperacute T waves in the precordial leads. Sometimes reciprocal inf.STD appears before obvious STE in the ant.leads.
Note here: there are many causes of STD. It usually doesn't mean the lead showing it is necessarily ischemic; rather, it usually means the opposite leads are ischemic, producing STD as a reciprocal change in the leads facing them.
So our first reflex on seeing STD should be to check the opposite leads for STE. If it's there, you can almost diagnose AMI. But there are some STD situations where, once you see them, you have to consider it AMI.
- Fig.16: maximal STD in V2~V4 → consider Post.OMI (you can consider doing Post.leads, but not seeing STE in the Post.leads can't completely rule it out).
- Fig.17: Upsloping STD with large/symmetric T waves in the Precordial leads → suggests proximal LAD complete or near complete ACO ➡ needs immediate treatment; don't wait for STE to appear. And whether STE will appear before substantial myocardial necrosis is not certain. The T wave here isn't necessarily tall, but it will be very wide and large (bulky), just like a typical Hyperacute T wave.
- Fig.18: if the STD is in multiple leads, especially Maximal STD in V5~V6 (including I/II), with STE in aVR or V1 ➡ this suggests an LMCA or TVD or Proximal LAD problem, but without full occlusion. (If the previous ECG was relatively normal, be even more suspicious in the appropriate clinical context)
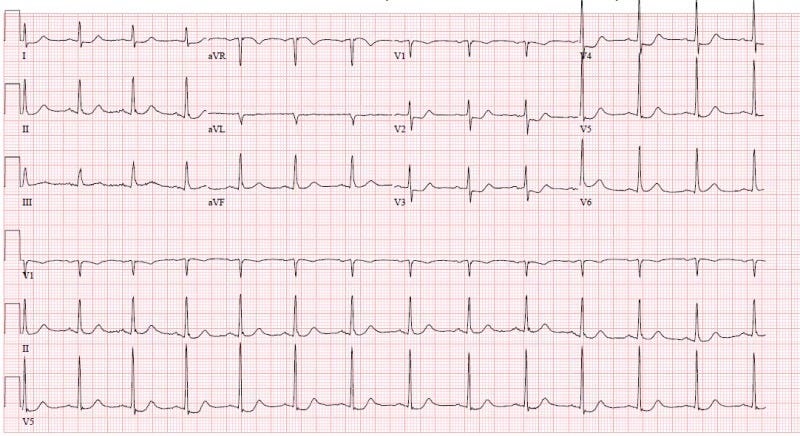
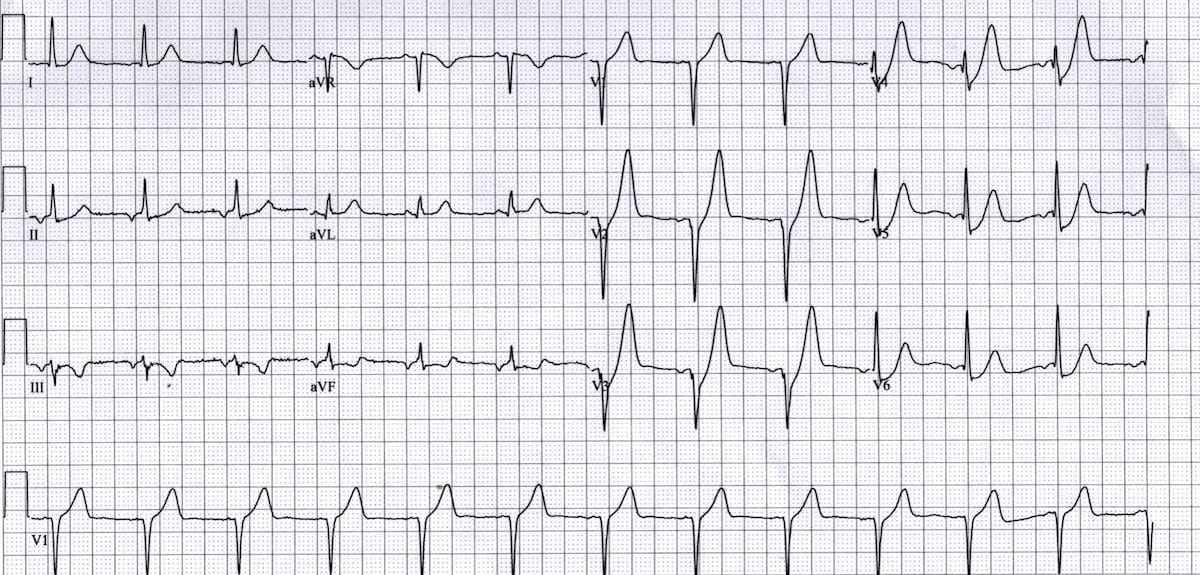
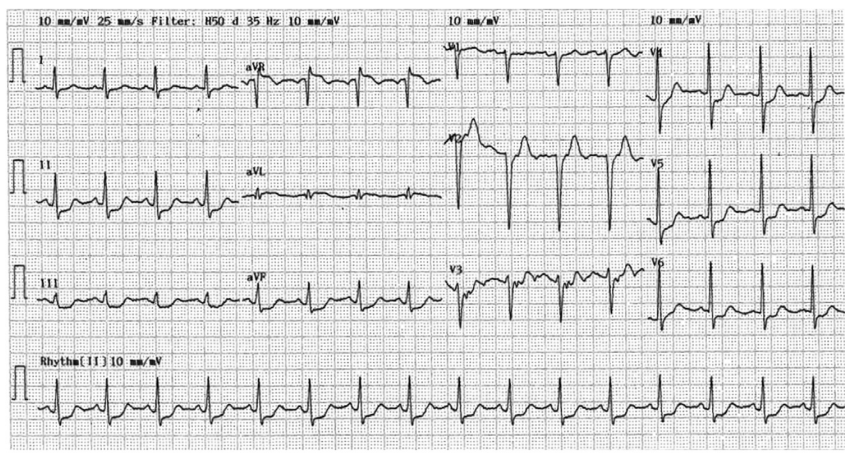
Tips: Note that STD may actually be STE too
Step 9: Look for Hyperacute T waves (HATW)
There's currently no formal definition of the Hyperacute T wave. But amplitude alone isn't enough to describe it. The author believes defining it by bulk is more appropriate, and the T wave's bulk has to be judged relative to the QRS size
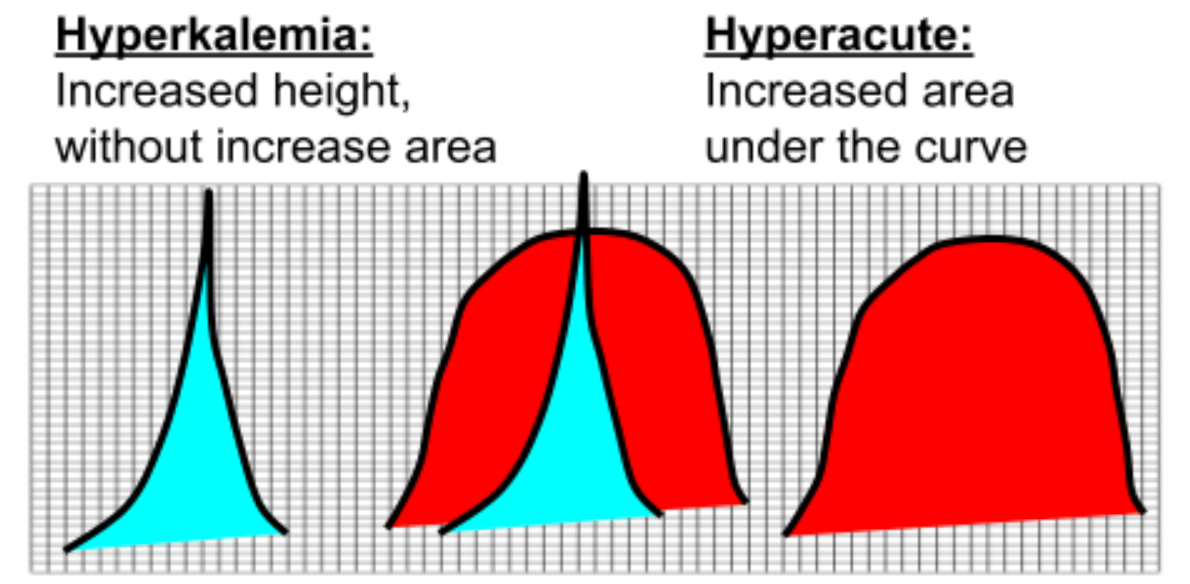
- Bulk is assessed by measuring the AUC ➡ look at height, width, and the amount of upward ST concavity (the straighter the ST, the larger the AUC, and the bulkier the T wave)

Tips: Amal Mattu often says: if the whole QRS fits inside the T wave, suspect HATW
Step 10: When everything is normal but clinical suspicion is high, recheck everything
Some ECG machines calculate the other leads from lead I/II. Sometimes this can produce an internal machine error that leaves lead II blank, and you could completely miss an inferior OMI
Consider other supplemental leads ➡ Right side ECG, Post.leads
If the supplemental leads don't show the problem either, do an ECG every 15 minutes during the first hour, and more often if the pain is getting worse.
If clinical suspicion is very high, you can trend serial hsTnI, bedside echo, coronary CTA, etc.
Every ECG sign depends on the patient's Pretest probability; the more subtle the ECG sign, the higher the pretest probability needed.
Tips: If the initial ECG can't give an OMI diagnosis but you're still clinically suspicious → Serial F/U ECGs
-Symptomatic: one every 15 minutes (watch for ACO evolution)
-Symptoms change (present → absent or absent → present, do one either way): look for ECG dynamic change (only MI does this)
References
Aslanger, E. K. (n.d.). __myocardial infarction and differentiating it from mimics: Ten steps to or away from cath lab ↩︎
Diagnosing AMI in LBBB or paced rhythm: have you filled in all the gaps? ↩︎
Armstrong, E. J., Kulkarni, A. R., Bhave, P. D., Hoffmayer, K. S., MacGregor, J. S., Stein, J. C., Kinlay, S., Ganz, P., & McCabe, J. M. (2012). Electrocardiographic Criteria for ST-Elevation Myocardial Infarction in Patients With Left Ventricular Hypertrophy. The American Journal of Cardiology, 110(7), 977–983. https://doi.org/10.1016/j.amjcard.2012.05.032 ↩︎
Subtle Anterior STEMI Superimposed on Anterior LV Aneurysm Morphology ↩︎
Aslanger, E., Yıldırımtürk, Ö., Şimşek, B., Sungur, A., Türer Cabbar, A., Bozbeyoğlu, E., Karabay, C. Y., Smith, S. W., & Değertekin, M. (2020). A new electrocardiographic pattern indicating inferior myocardial infarction. Journal of Electrocardiology, 61, 41–46. https://doi.org/10.1016/j.jelectrocard.2020.04.008 ↩︎
Why do we liberally record ECGs? And what do you think the angiogram showed? ↩︎
Aslanger, E., Yıldırımtürk, Ö., Bozbeyoğlu, E., Şimşek, B., Karabay, C. Y., Türer Cabbar, A., Kozan, Ö., & Değertekin, M. (2018). A Simplified Formula Discriminating Subtle Anterior Wall Myocardial Infarction from Normal Variant ST-Segment Elevation. The American Journal of Cardiology, 122(8), 1303–1309. https://doi.org/10.1016/j.amjcard.2018.06.053 ↩︎
Thoughts on this case? Leave a comment, a like, or a reaction below.
comments powered by Disqus