ER Bear's Heart NotesAn editorial notebook

OMI ECG findings

⭐️ = finding added in 2025

Based on QRSTU

NTTV1

New Tall T wave in V1

T wave in V1 taller than V6 ➜ NTTV1

  • A T wave in V1 taller than V6, especially when it's new (a New Upright T wave, or TV1>TV6) ➜ suspect CAD or acute ischemia. The mechanism is a mirror image of posterior (posterior/inferobasal) ischemia or injury, which is why it's tied to the LCx, not the LAD.
  • How to judge it: compare the T waves in V1 and V6 on the same ECG, not against a memorized absolute height (in mm). If there's an old ECG, always pull it up and compare. The "N" in NTTV1 stands for New; without an old ECG all you have is TTV1, and the evidence is a notch weaker.
  • NTTV1 isn't there to make a diagnosis; it's there to wake your eyes up. When you see it, go back and look for STD in V2–V3 and for taller R waves, dig out the old ECG, and get another ECG, rather than calling the CV man right away.

Criteria

  • Manno 1983 (218 patients undergoing diagnostic cardiac catheterization for chest pain): an upright T wave in V1 (with 0.15 mV as the cutoff) was common in isolated LCx disease and rare in isolated LAD disease; in multivessel disease, an upright T wave in V1 was also common whenever the LCx was diseased.
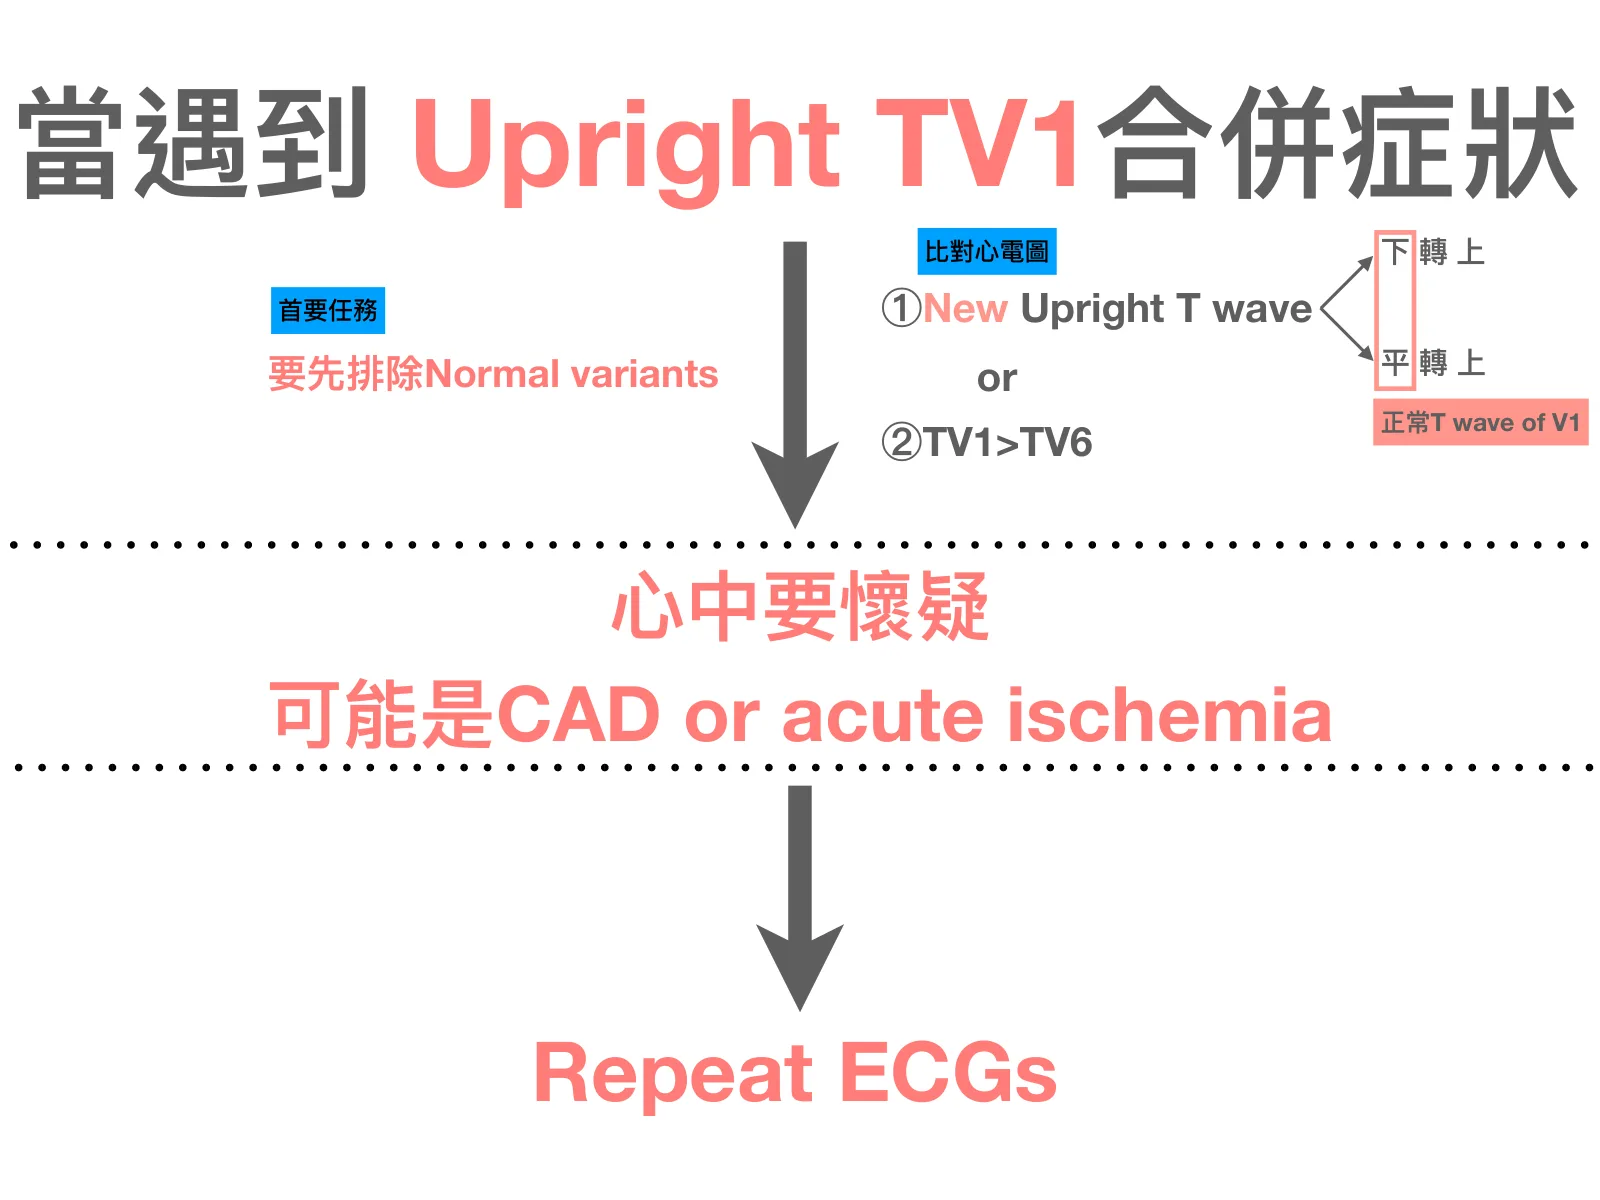
Slide (in Chinese) titled "When an upright TV1 comes with symptoms," a flowchart: on the left, a blue label "First priority" reads "Rule out normal variants first"; on the right, a blue label "Compare ECGs" lists ① New Upright T wave or ② TV1>TV6, next to two lines, "inverted → upright" and "flat → upright," with a pink box around "inverted/flat" and the note "normal T wave of V1"; the middle reads "Suspect in your mind" and "possibly CAD or acute ischemia," and at the bottom an arrow points to "Repeat ECGs." The whole slide is a text-and-arrow flowchart with no real ECG waveforms.
From my 2025 ECG teaching slides for residents at Chi Mei Medical Center (slide 72); a reading flowchart I drew myself

Sources

  1. Manno BV, Hakki AH, Iskandrian AS, Hare T. Significance of the upright T wave in precordial lead V1 in adults with coronary artery disease. J Am Coll Cardiol. 1983 May;1(5):1213-5. PMID 6833662
  2. LITFL (Ed Burns). T wave. ECG Library Basics
  3. Smith SW, Khalil A, Henry TD, et al. Electrocardiographic differentiation of early repolarization from subtle anterior ST-segment elevation myocardial infarction. Ann Emerg Med. 2012 Jul;60(1):45-56.e2. PMID 22520989 (original source of the counterargument to NTTV1)
  4. Dr. Smith's ECG Blog. Is there evidence of OMI on this ECG? (Ken Grauer's comment section)
  5. Rezaie S. EKG Subtlety: Tall T-Wave in Lead V1. ALiEM
Based on QRSTU

HATW

Hyperacute T wave

T wave too fat and too symmetric relative to the QRS ➜ HATW. Remember: it's "the R wave gets shorter," not "the T wave gets taller."

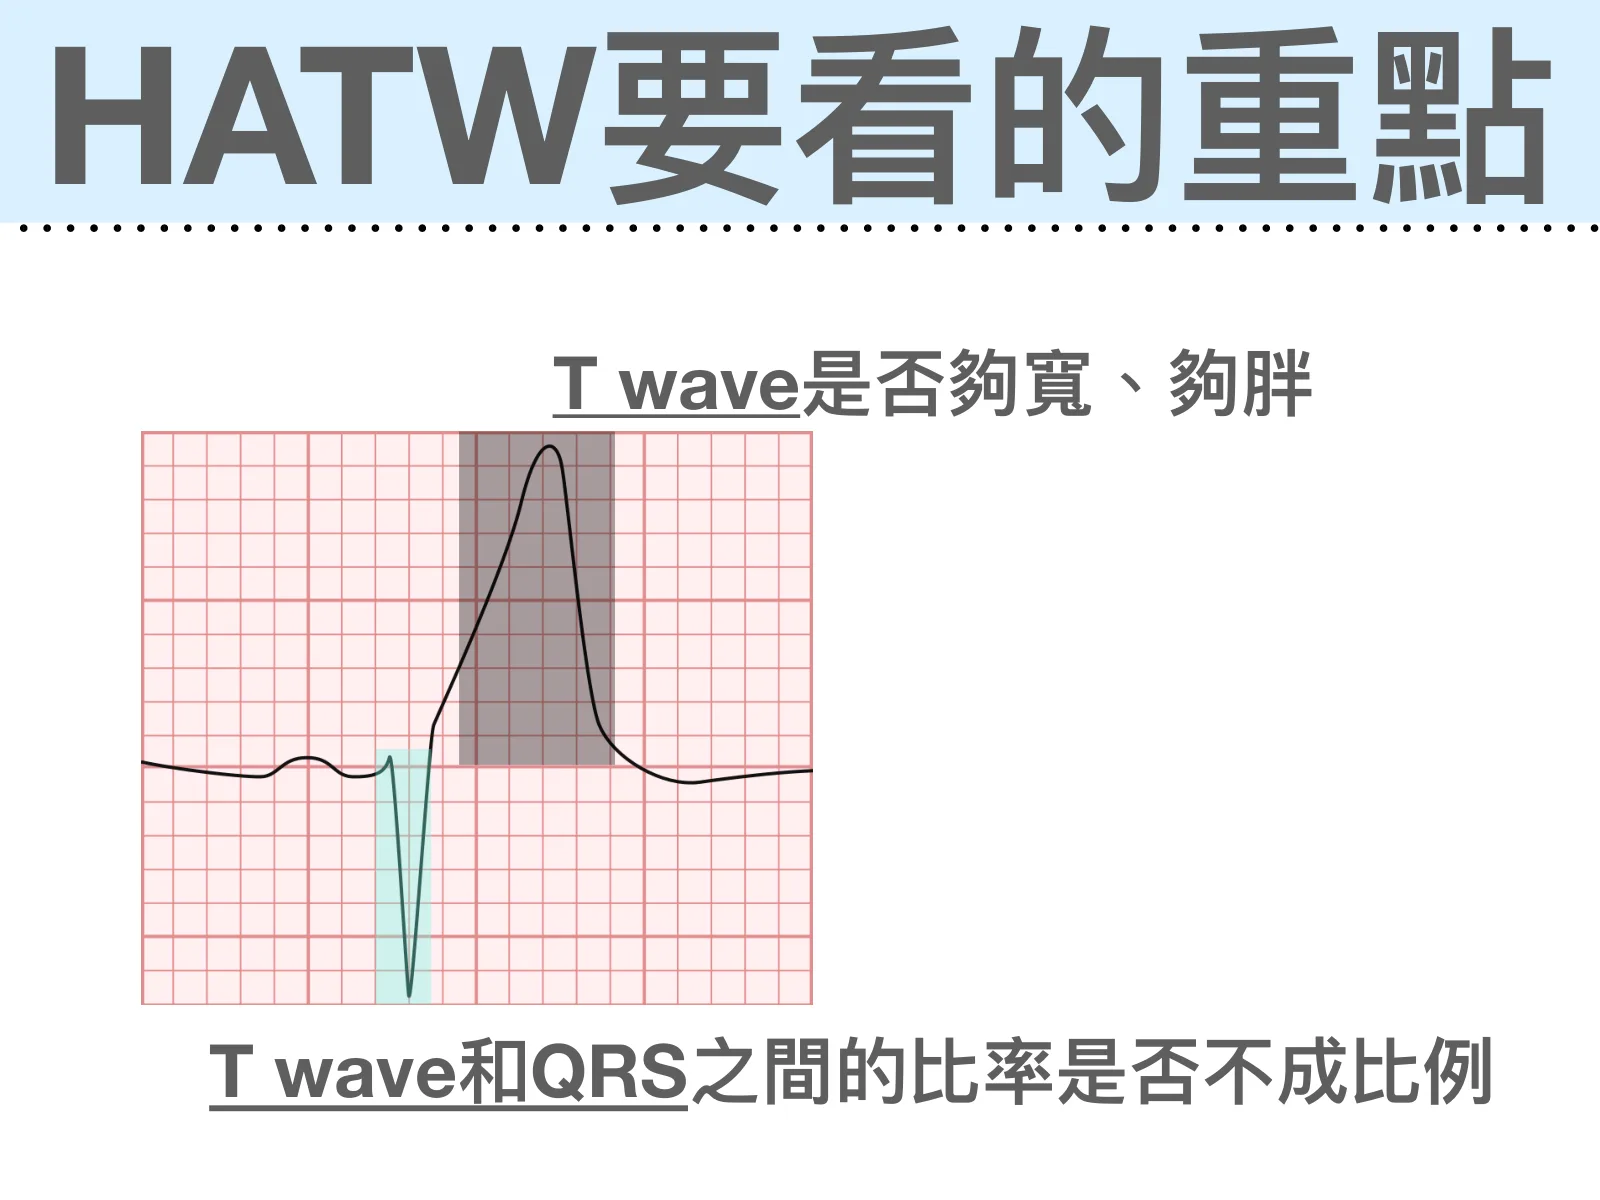
  • A hyperacute T wave isn't "tall," it's "fat." The criterion is area under the curve relative to the QRS, plus symmetry.
  • HATW isn't "the mountain got taller," it's "the mountain got fatter." The area gets bigger, not the height.

Criteria

  • HATW score (Meyers 2025, JACC Adv): makes HATW objective with two measurements, T-wave magnitude (T-wave area relative to QRS amplitude) and symmetry (T-wave peak-to-end time relative to onset-to-peak time); derivation and validation were evaluated in separate groups. The authors conclude that this is the first objective definition of HATW and that it shows significant clinical utility as an ECG finding of acute coronary occlusion in patients with suspected ACS. For the cutoff and the specificity, sensitivity, PPV, LR+, and other numbers, I've only found one source so far (the original paper), so this page doesn't list them for now.
Slide (in Chinese) "What to look for in HATW": a magnified ECG waveform with a dark gray block over the T wave and a light green block over the QRS; the text above reads "Is the T wave wide enough, fat enough?" and below, "Is the ratio between the T wave and the QRS disproportionate?"
From my 2025 ECG teaching slides for residents at Chi Mei Medical Center (slide 89)
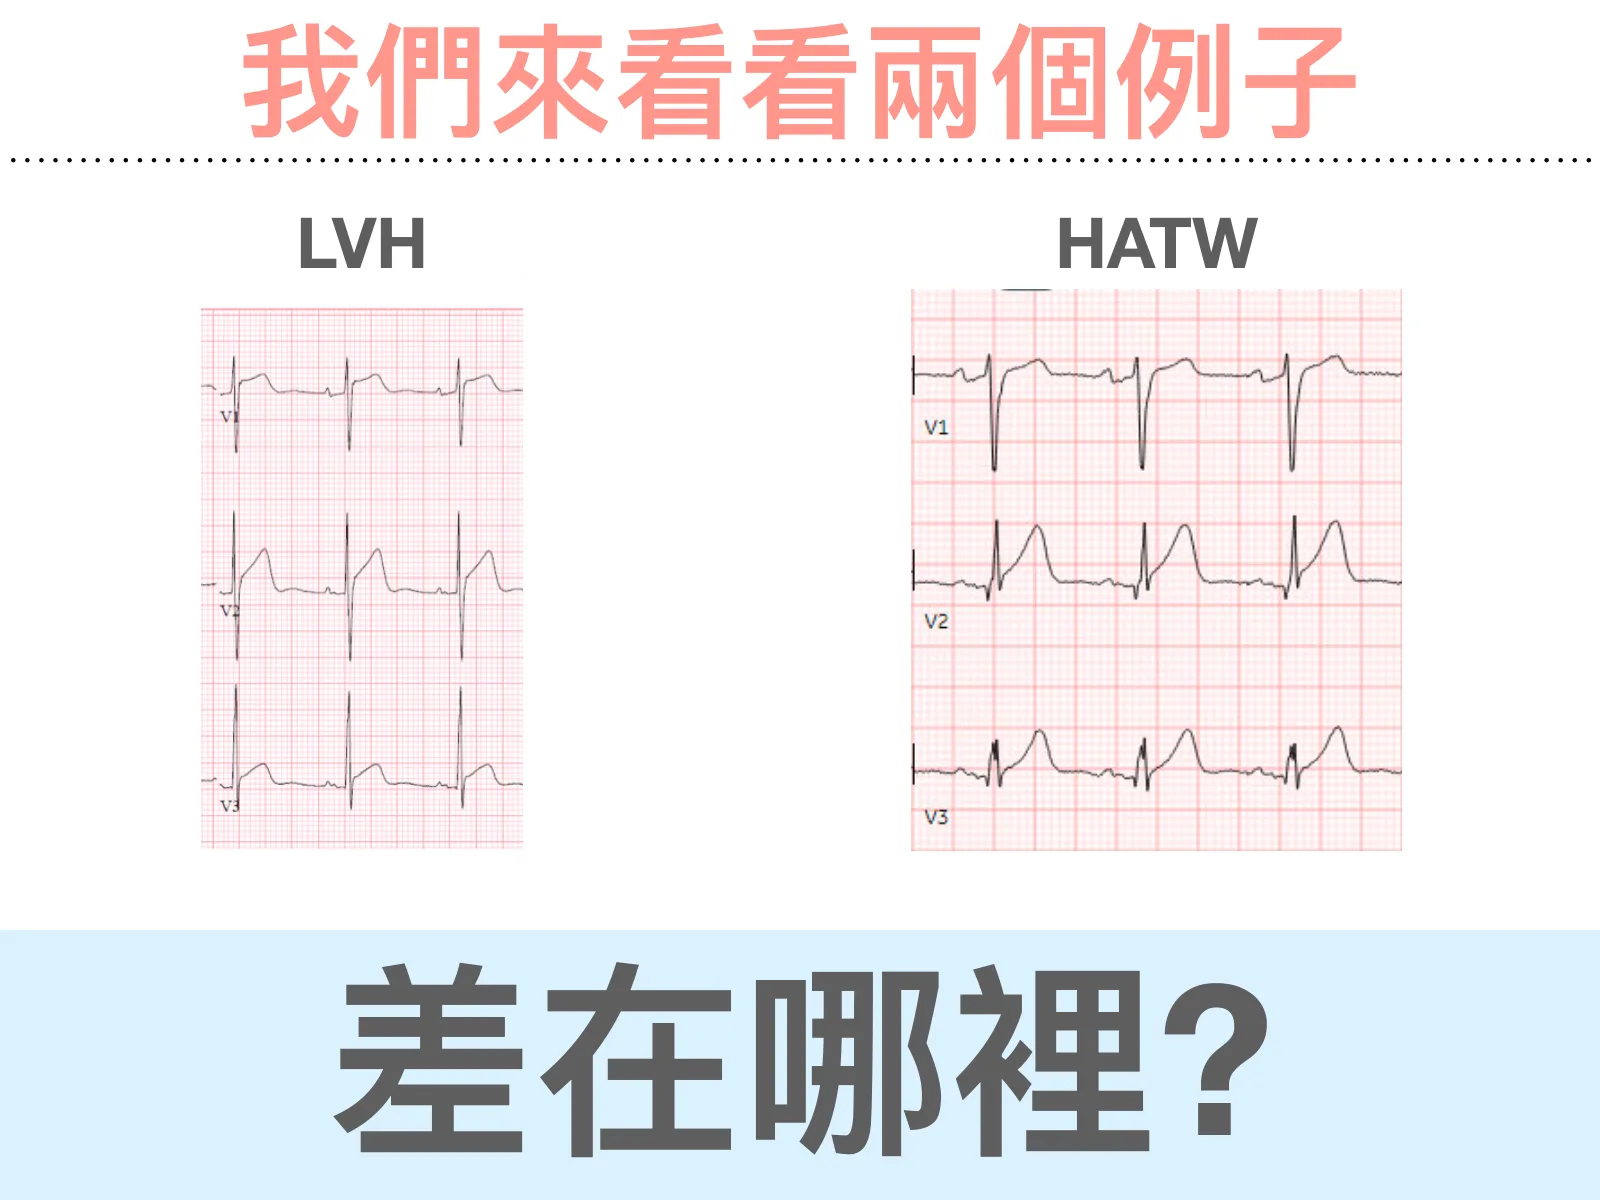
Slide (in Chinese) "Let's look at two examples": V1 to V3 of LVH on the left, V1 to V3 of HATW on the right, and below, a large question on a blue background: "What's the difference?"
Same slide deck (slide 88): V1–V3 of LVH and of HATW side by side. What's the difference?

Sources

  1. Meyers HP, Simančík F, Herman R, Rafajdus A, Frick WH, Nunes de Alencar J, Aslanger EK, Smith SW. Hyperacute T Waves Are Specific for Occlusion Myocardial Infarction, Even Without Diagnostic ST-Segment Elevation. JACC Adv. 2025;4(10 Pt 2):102120. PMID 40892623
  2. Mills NL, Newby LK, Zaman S, et al. Fifth Universal Definition of Myocardial Infarction (2026). Glob Heart. 2026;21:64. DOI 10.5334/gh.1578 (open access; published simultaneously in Circulation, DOI 10.1161/CIR.0000000000001477); Table 5 lists the definition of hyperacute T waves

Based on QRSTU

Pathologic Q wave

New pathologic Q waves (especially with STE or hyperacute T waves) ➜ Pathologic Q wave

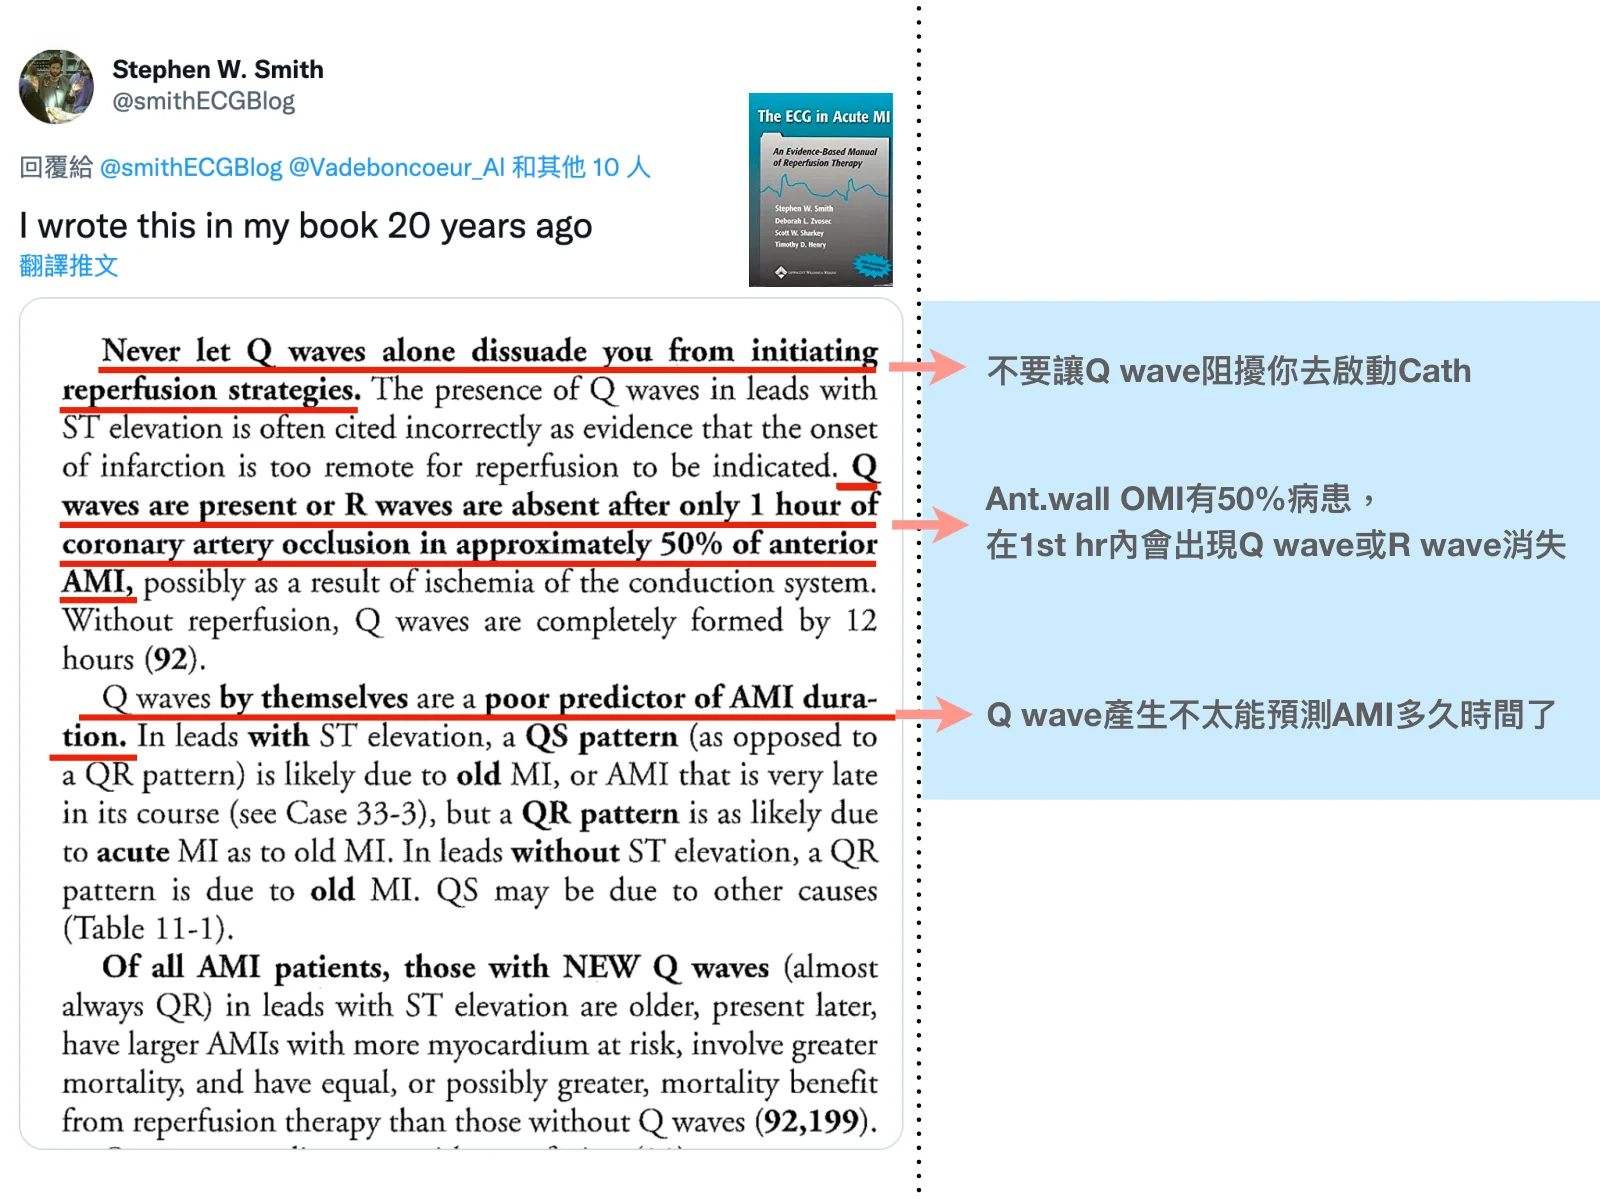
  • Pathologic Q wave ≠ old MI. Q waves may appear within the first hour of the acute phase, a Q wave doesn't exclude acute OMI, and abnormal Q waves on the initial ECG did not eliminate the effect of thrombolytic therapy in reducing infarct size.
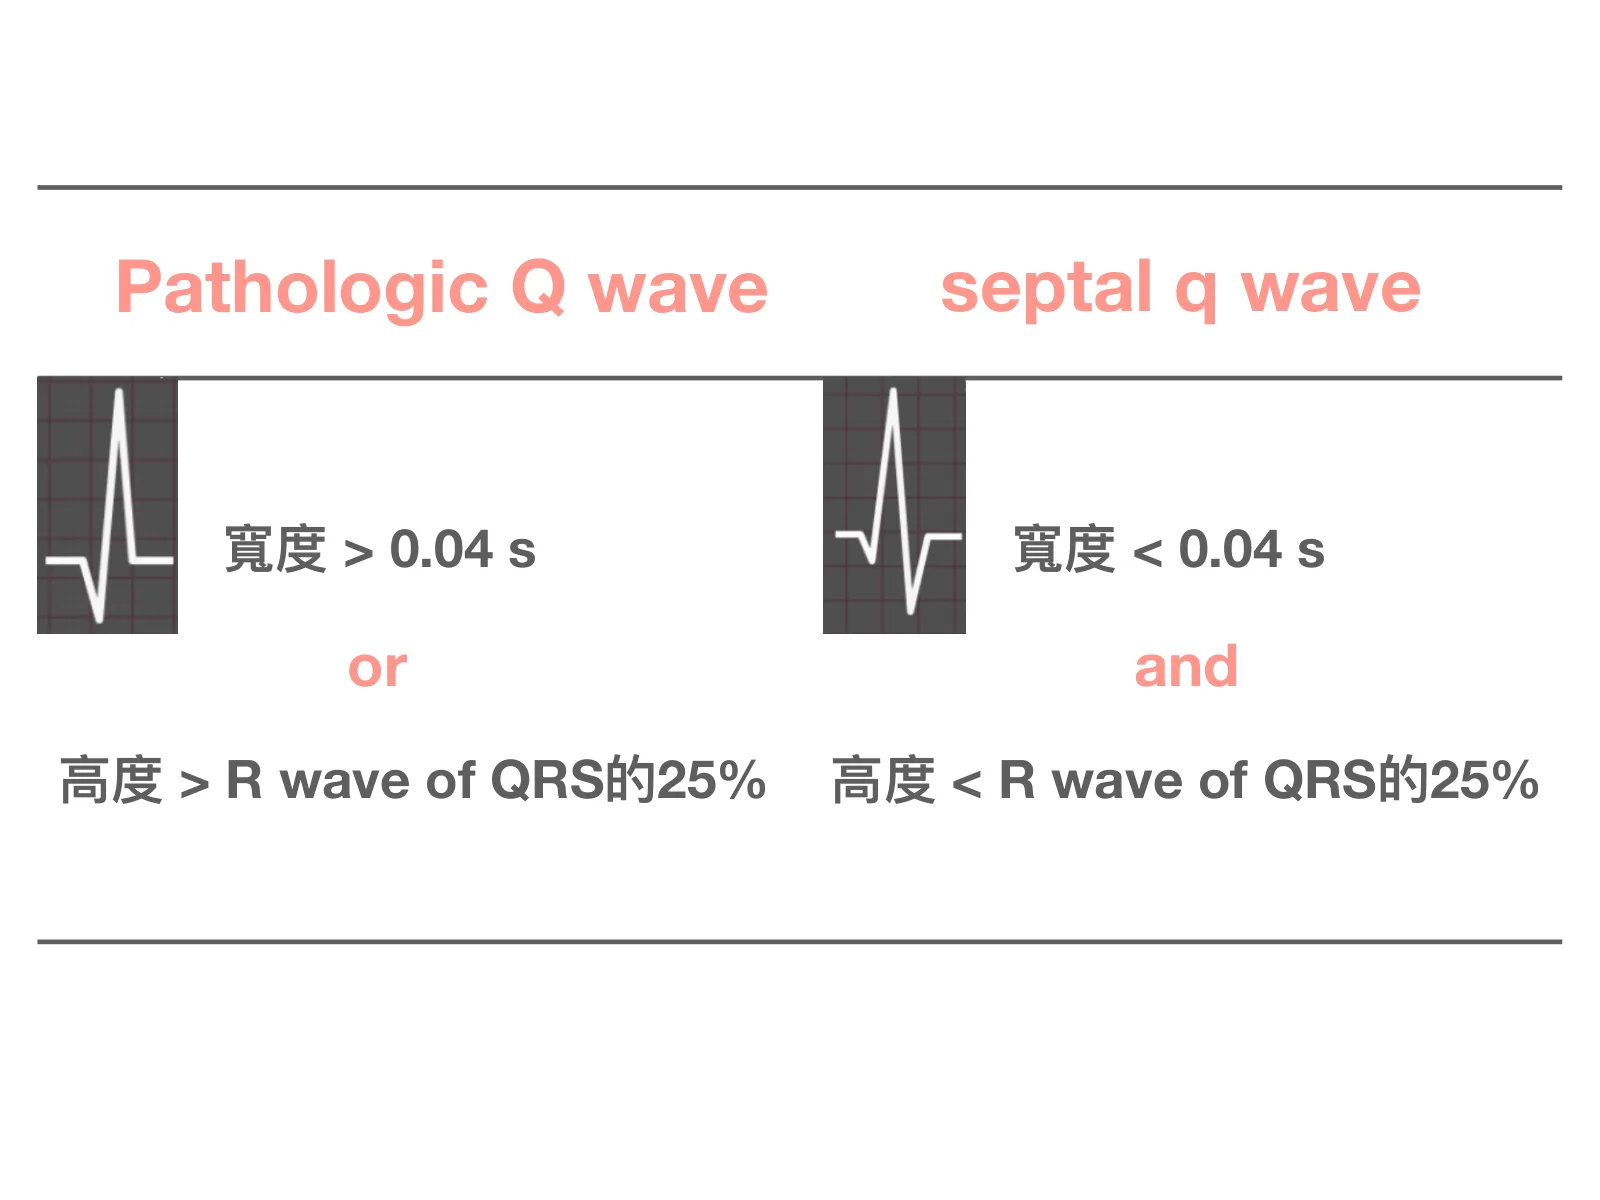
  • The logic of the criteria is asymmetric: meeting either of the two = pathologic (pathologic Q wave, or); both must be met to count as normal (septal q wave, and). To be called normal, the bar is actually higher.
  • An isolated QS in V1 can be normal; but in an OMI context, any Q wave in V2–V3 is abnormal (unless it's lead misplacement, LBBB, or a paced rhythm). Also, Qr in V1 is a fairly specific ECG sign of PE: when you see Qr in V1, both lights should go on at once, anterior OMI and PE.

Criteria

  • Fifth UDMI (2026) Table 5: Pathologic Q waves = Q-wave duration ≥40 ms and/or depth ≥25% of the R wave, in two contiguous leads. The main text explains that this is the classical definition (the denominator is the R wave in the same lead); prior versions of the UDMI used a different definition, and the fifth edition adopted the classical one because it correlates better with transmural myocardial infarction on CMR.
Slide (in Chinese) comparing two columns side by side: the left column, "Pathologic Q wave," is labeled "width > 0.04 s," "or," "height > 25% of the R wave of the QRS"; the right column, "septal q wave," is labeled "width < 0.04 s," "and," "height < 25% of the R wave of the QRS"; each column has a small QRS sketch on a dark gray grid.
From my 2025 ECG teaching slides for residents at Chi Mei Medical Center (slide 101): criteria for a pathologic Q wave vs a normal septal q wave (the Fifth UDMI writes "≥," and requires it in two contiguous leads)
Screenshot of a post on X (Twitter) by Dr. Stephen W. Smith himself: "I wrote this in my book 20 years ago," with a thumbnail of the cover of his textbook The ECG in Acute MI and a passage of its text (red lines marking sentences such as "Never let Q waves alone dissuade you from initiating reperfusion strategies"); on the right are three takeaways I added in Chinese: don't let Q waves stop you from activating the cath lab; anterior OMI can show Q waves or loss of R waves within the first hour; Q waves are hard to use for estimating how long ago the AMI happened.
From my 2025 ECG teaching slides for residents at Chi Mei Medical Center (slide 103); image: Dr. Stephen W. Smith's own public post on X (@smithECGBlog), quoting the text of his textbook The ECG in Acute MI

Sources

  1. Mills NL, Newby LK, Zaman S, et al. Fifth Universal Definition of Myocardial Infarction (2026). Glob Heart. 2026;21:64. DOI 10.5334/gh.1578 (open access; published simultaneously in Circulation, DOI 10.1161/CIR.0000000000001477)
  2. Thygesen K, Alpert JS, Jaffe AS, et al. Fourth Universal Definition of Myocardial Infarction (2018). Circulation. 2018;138(20):e618-e651. PMID 30571511
  3. LITFL (Ed Burns, Robert Buttner). Q Wave. ECG Library Basics
  4. Raitt MH, Maynard C, Wagner GS, Cerqueira MD, Selvester RH, Weaver WD. Appearance of abnormal Q waves early in the course of acute myocardial infarction: implications for efficacy of thrombolytic therapy. J Am Coll Cardiol. 1995 Apr;25(5):1084-8. PMID 7897120
  5. Dr. Smith's ECG Blog (Magnus Nossen, edits by Smith). Chest pain followed by 6 days of increasing dyspnea - what happened? 2025-02-26
  6. Dr. Smith's ECG Blog. Judge for yourself the management of this patient with "NSTEMI, multivessel disease". 2023-09-10 (Ken Grauer's comment section)
  7. Kucher N, Walpoth N, Wustmann K, Noveanu M, Gertsch M. QR in V1--an ECG sign associated with right ventricular strain and adverse clinical outcome in pulmonary embolism. Eur Heart J. 2003 Jun;24(12):1113-9. PMID 12804925 (the Qr in V1 PE trap)
  8. LITFL (Ed Burns, Robert Buttner). Hypertrophic Cardiomyopathy (HCM). ECG Library Diagnosis
  9. LITFL (Ed Burns, Robert Buttner). Pre-excitation syndromes. ECG Library Diagnosis
  10. Dr. Smith's ECG Blog. Chest Pain and Q-waves in V1 and V2. Is there previous septal MI? 2018-11-04

Based on QRSTU

Subtle STE (not meeting STEMI criteria)

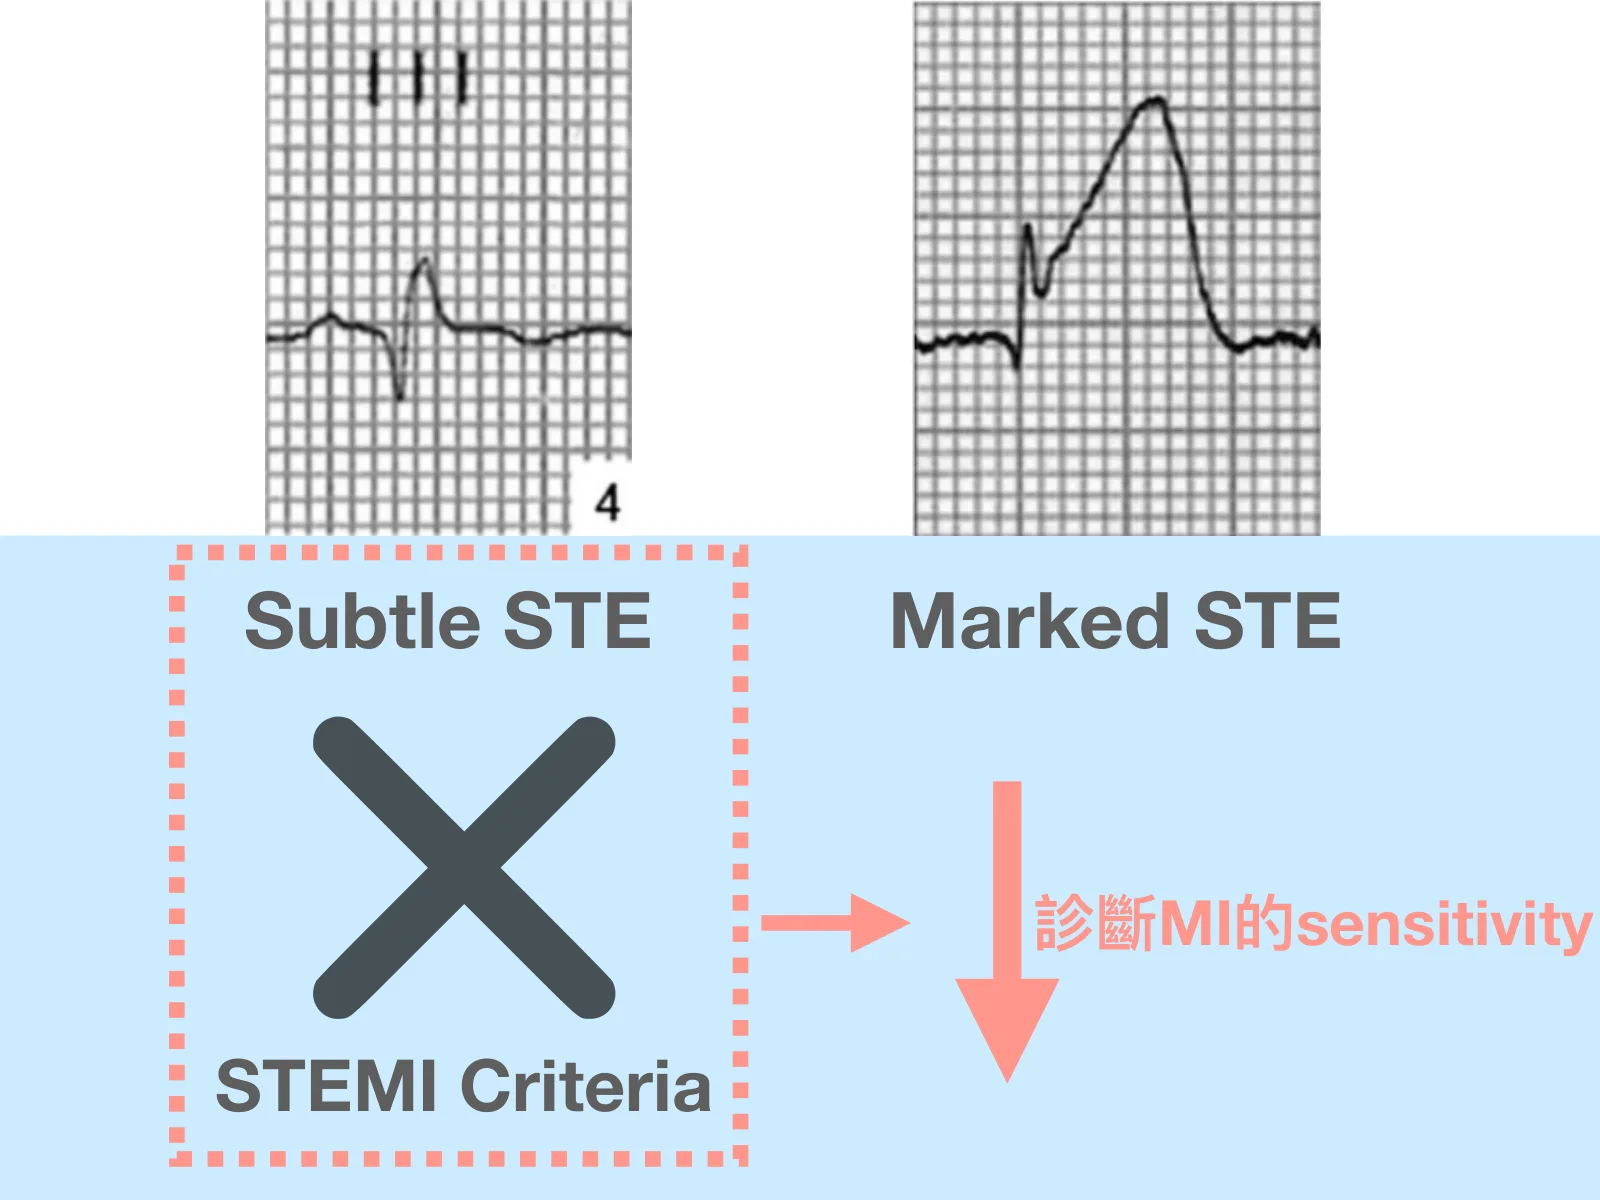
STE present but not reaching STEMI criteria ➜ Subtle STE

  • Subtle STE = ST elevation that doesn't reach the STEMI criteria threshold. The sensitivity of STEMI criteria themselves isn't high: Hillinger 2019 (prospective, multicenter, software-automated measurement of the first ECG on arrival, compared against the final adjudicated STEMI diagnosis) and Martin 2007 (with ceMRI-diagnosed AMI as the gold standard) both show that relying on STEMI criteria alone misses a large group of MIs.
  • Don't look only at absolute height (in mm); look at proportion: in a lead with small QRS voltage, an occluded artery may not be able to squeeze out even 1 mm. Look instead at ST-segment morphology (is it straightening or turning convex? normal early repol is upwardly concave), whether there's reciprocal change (often easier to spot than the STE itself), whether the T wave is getting fatter along with it, and compare with the old ECG and with a repeat ECG.
  • For subtle STE to count, you need clinical context + morphology + teammates all present together; it's not about picking up the phone over any tiny bit of STE under 1 mm. That's acting like you just found a loaded gun.

Criteria

  • STEMI criteria (Fifth UDMI main text §13; same cutoffs as Fourth UDMI Table 2): new ST elevation at the J point in two contiguous leads; in V2–V3: men <40 years ≥2.5 mm, men ≥40 years ≥2 mm, women of any age ≥1.5 mm; other leads ≥1 mm; provided there is no LVH or LBBB.
  • AHA Mission: Lifeline (ACTION Registry–GWTG) national registry data (Riley 2013): among patients with a final diagnosis of STEMI, a subset had a non-diagnostic first ECG and were diagnosed on subsequent ECGs; most of them developed diagnostic changes shortly after the first ECG; compared with patients diagnosed on the first ECG, there was no significant difference in guideline-based treatment, in-hospital major bleeding, or death.
Slide (in Chinese) with two ECG strips side by side at the top: on the left, subtle ST elevation in lead III (with the figure number 4 printed in the corner); on the right, obvious ST elevation. Below, on a light blue background, the left column "Subtle STE" is inside a pink dashed box with a big X over the words "STEMI Criteria"; the right column reads "Marked STE," and a pink arrow points to a downward arrow and "sensitivity for diagnosing MI."
From my 2025 ECG teaching slides for residents at Chi Mei Medical Center (slide 119): look only at STEMI criteria and subtle STE gets missed, so the sensitivity for diagnosing MI drops. The two ECG strips at the top are used for teaching (the slide notes cite Martí 2014).

Sources

  1. Mills NL, Newby LK, Zaman S, et al. Fifth Universal Definition of Myocardial Infarction (2026). Glob Heart. 2026;21:64. DOI 10.5334/gh.1578 (open access; published simultaneously in Circulation, DOI 10.1161/CIR.0000000000001477)
  2. Thygesen K, Alpert JS, Jaffe AS, et al. Fourth Universal Definition of Myocardial Infarction (2018). Circulation. 2018;138(20):e618-e651. PMID 30571511
  3. LITFL (Chris Nickson). Acute Coronary Syndromes. CCC Cardiology
  4. Hillinger P, et al. Prospective validation of current quantitative electrocardiographic criteria for ST-elevation myocardial infarction. Int J Cardiol. 2019;292:1-12. PMID 31056411
  5. Martin TN, et al. ST-segment deviation analysis of the admission 12-lead electrocardiogram as an aid to early diagnosis of acute myocardial infarction with a cardiac magnetic resonance imaging gold standard. J Am Coll Cardiol. 2007;50(11):1021-8. PMID 17825710
  6. Riley RF, Newby LK, Don CW, et al. Diagnostic time course, treatment, and in-hospital outcomes for patients with ST-segment elevation myocardial infarction presenting with nondiagnostic initial electrocardiogram: a report from the American Heart Association Mission: Lifeline program. Am Heart J. 2013 Jan;165(1):50-6. PMID 23237133
  7. Dr. Smith's ECG Blog (Steve Smith). Signed off as "normal, no concern". 2026-04-17
  8. LITFL (Mike Cadogan, Robert Buttner). High Lateral STEMI. ECG Library Diagnosis
  9. Alanís Naranjo JM, Rivera Hermosillo JC. South African flag sign. Oxf Med Case Reports. 2023;2023:omad104. PMID 37881265

Based on QRSTU

Inverted U wave

▶ Animation 1:01

Upside-down U wave ➜ Inverted U wave. Very rare, but every one you catch counts.

  • Definition: in a lead with an upright T wave, a downward U wave after the T wave ends (Neg U under T(+)). A normal U wave goes in the same direction as the T wave and gets more prominent as the heart rate slows.
  • The key to recognizing it: use the QT interval as calipers. Find a lead where the QT interval is clear cut and carry that QT length over to the suspicious lead: if it falls outside the QT interval, it's an inverted U wave; if it falls inside, it's the second half of a biphasic T wave.
  • It can appear earlier than STE, and it can appear when there's no chest pain. That's what makes it as precious as HATW: an early signal.

Criteria

  • Gerson 1979 (exercise-induced): exercise-induced U-wave inversion was highly predictive of significant coronary artery disease, especially proximal LAD disease. Gerson 1980 (at rest): among patients undergoing coronary angiography, resting U wave negativity was a significant predictor of ≥75% LAD or left main stenosis and of LV dysfunction.

Teaching animation

Inverted U wave

Upright T wave, but the U wave after it points down: in a chest pain patient, treat it as an ischemia warning sign

▶ 1:01 ECG Animations

References
  • Braunwald's Heart Disease
  • Chou's Electrocardiography 6e
  • Marriott's Practical Electrocardiography 13e
  • LITFL "U Wave"
  • ECG Weekly "Inverted U Waves"
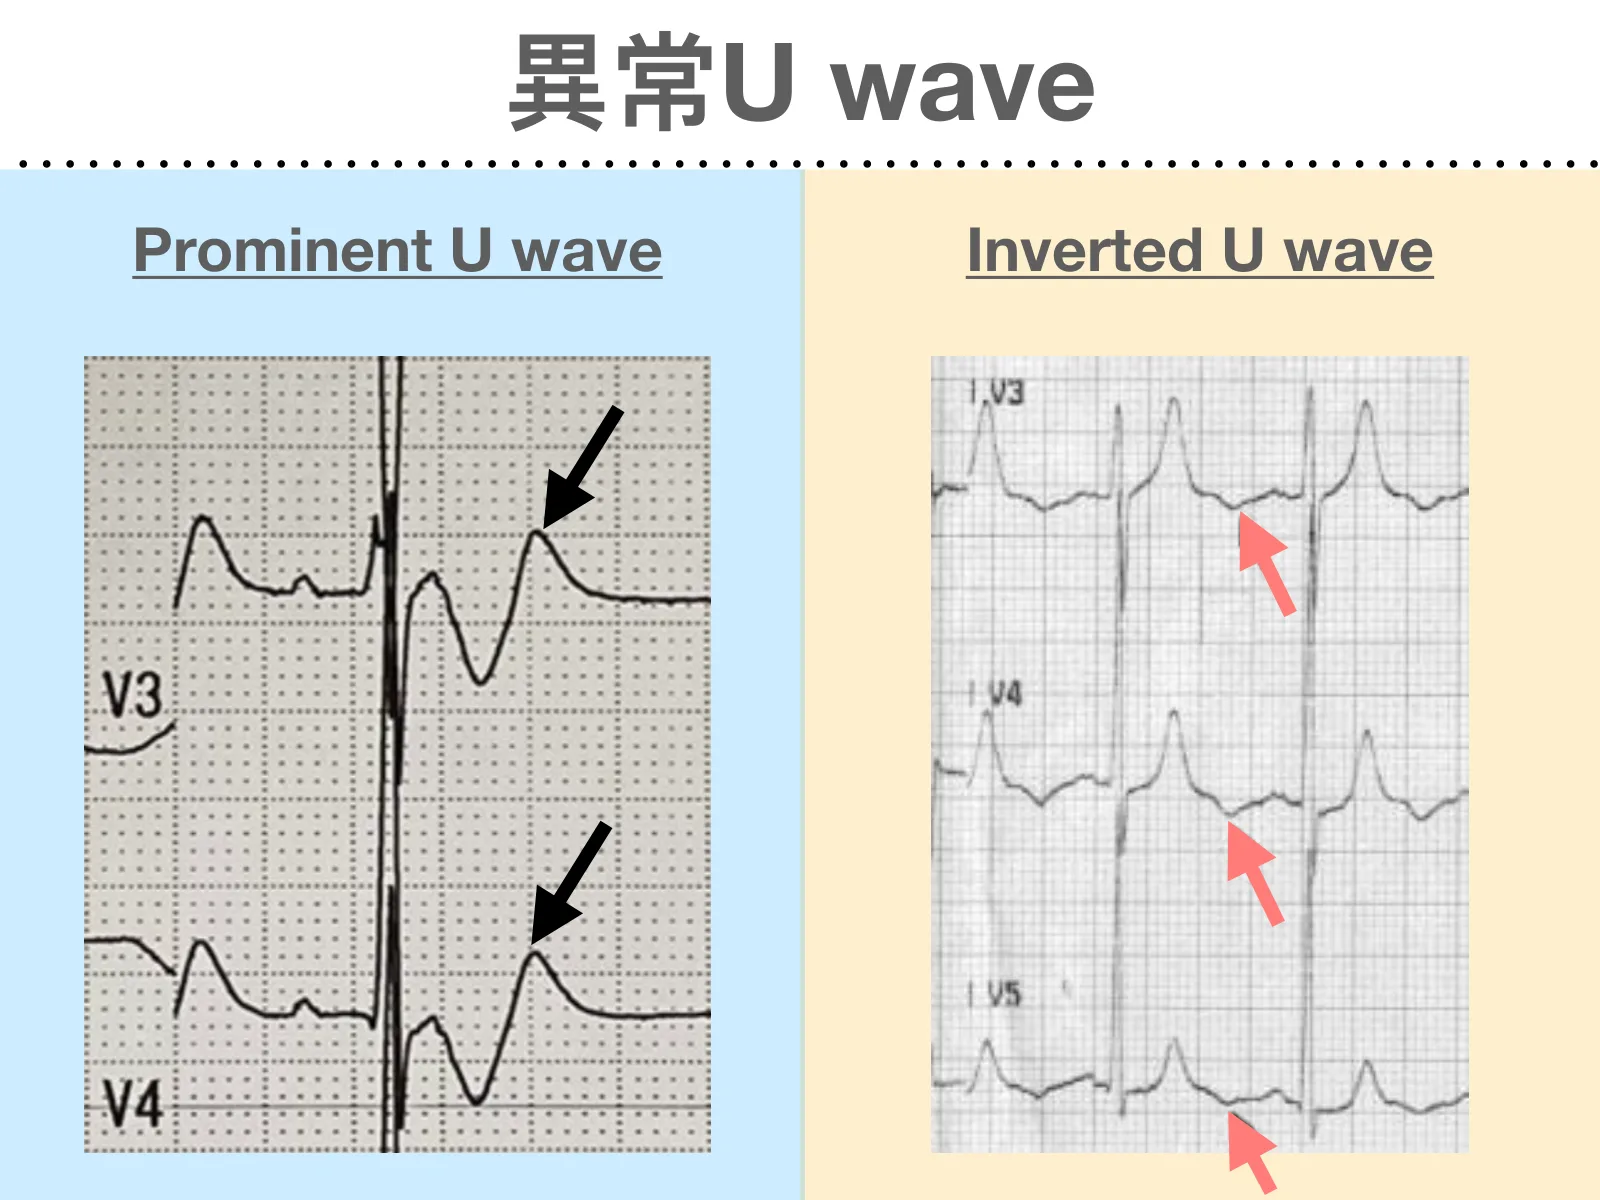
Slide (in Chinese) "Abnormal U waves," a side-by-side comparison: on the left, on a light blue background, "Prominent U wave," with a black arrow in each of V3 and V4 pointing to an upward U wave after the T wave; on the right, on a beige background, "Inverted U wave," with a pink arrow in each of V3, V4, and V5 pointing to a downward U wave after the T wave.
From my 2025 ECG teaching slides for residents at Chi Mei Medical Center (slide 132): prominent U wave vs inverted U wave. The ECG on the right is from Girish MP, et al. Indian Pacing Electrophysiol J. 2005 (Figure 1A); the ECG on the left is from a public case online.
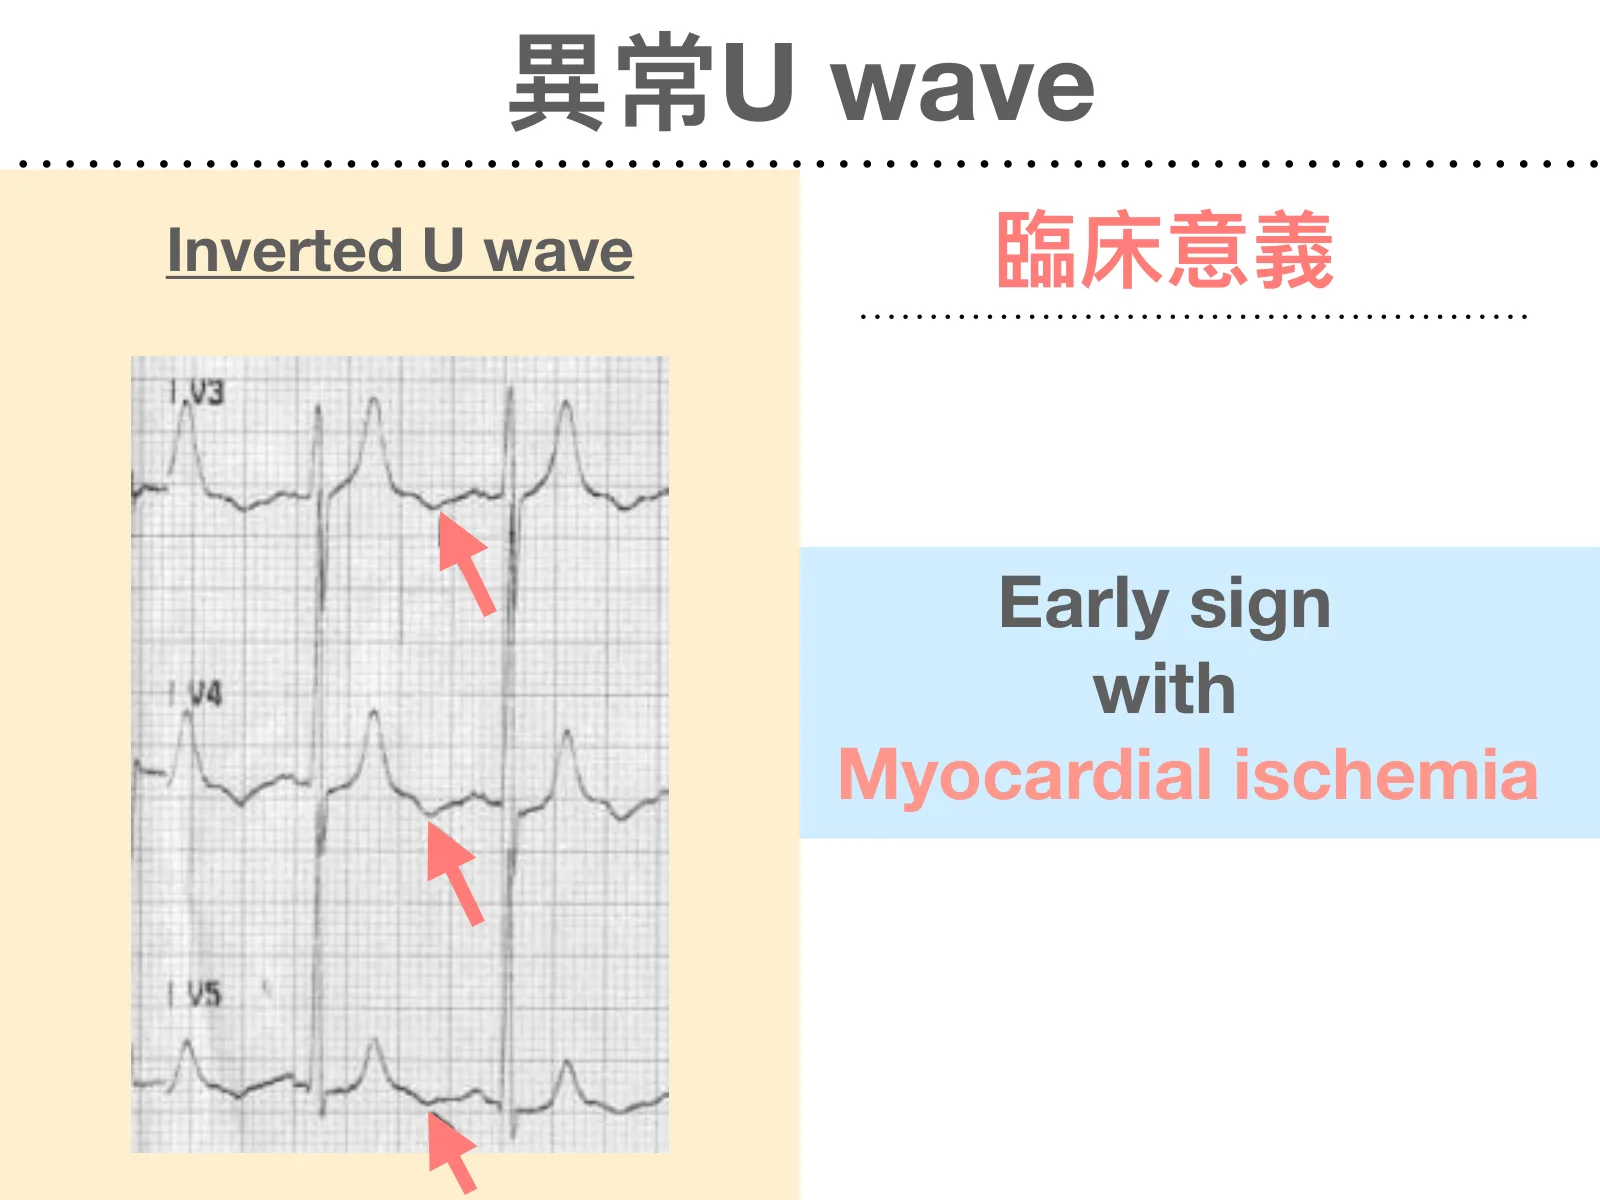
Slide (in Chinese) "Abnormal U waves": on the left, on a beige background, "Inverted U wave," ECGs of leads V3, V4, and V5 with pink arrows pointing to the downward-dipping U wave after the T wave; on the right, "Clinical significance," in large text on a blue background: "Early sign," "with," "Myocardial ischemia."
From my 2025 ECG teaching slides for residents at Chi Mei Medical Center (slide 133), showing the clinical significance of the inverted U wave; ECG from Girish MP, et al. U wave: an important noninvasive electrocardiographic diagnostic marker. Indian Pacing Electrophysiol J. 2005;5(1):63-5 (Figure 1A)

Sources

  1. Gerson MC, Phillips JF, Morris SN, McHenry PL. Exercise-induced U-wave inversion as a marker of stenosis of the left anterior descending coronary artery. Circulation. 1979 Nov;60(5):1014-20. PMID 487534
  2. Gerson MC, McHenry PL. Resting U wave inversion as a marker of stenosis of the left anterior descending coronary artery. Am J Med. 1980 Oct;69(4):545-50. PMID 7424944
  3. LITFL (Ed Burns). U Wave. ECG Library Basics
  4. Reinig MG, Harizi R, Spodick DH. Electrocardiographic T- and U-wave discordance. Ann Noninvasive Electrocardiol. 2005 Jan;10(1):41-6. PMID 15649236
  5. Girish MP, Gupta MD, Mukhopadhyay S, Yusuf J, Sunil Roy TN, Trehan V. U wave: an important noninvasive electrocardiographic diagnostic marker. Indian Pacing Electrophysiol J. 2005;5(1):63-5. PMID 16943944 (source of the slide 133 ECG)
  6. Kishida H, Cole JS, Surawicz B. Negative U wave: a highly specific but poorly understood sign of heart disease. Am J Cardiol. 1982 Jun;49(8):2030-6. PMID 6211085
  7. Salmasi AM, Abraham R, al-Kutoubi A, Nicolaides AN. Exercise-induced inverted U wave in asymptomatic high-risk subjects. A preliminary study. Angiology. 1994 Sep;45(9):789-95. PMID 8092544

Based on QRSTU

New-onset bifascicular block

⭐️ New in 2025

New bifascicular block (RBBB + fascicular block, most commonly LAFB) + chest pain ➜ New-onset bifascicular block. It means the septal perforator has been cut off: an ominous sign of proximal LAD.

  • Mechanism: the right bundle branch and the left anterior fascicle are supplied mainly by the LAD's septal perforators; the first septal perforator (S1) comes off the proximal LAD and supplies the basal septum, bundle branches included. Proximal LAD or left main occlusion ➜ no blood to the septal perforator ➜ new RBBB+LAFB.
  • Catching "new" is the one key move: in Widimsky 2012, overall in-hospital mortality for RBBB and LBBB was similar; but new (or presumed new) RBBB 18.8% vs old RBBB 6.4%, a nearly threefold difference. When you see RBBB, the first thing isn't deciding left vs right; it's digging up the old ECG.
  • You'll often see downsloping STE: it doesn't look like a typical STEMI, so it's the easiest thing to call "secondary change from the BBB" and turn the page. Pendell Meyers put it even more bluntly on Dr. Smith's ECG Blog: patients with acute OMI plus RBBB+LAFB are either about to arrest, just resuscitated, or in cardiogenic shock.

Criteria

  • Widimsky 2012 (multicenter AMI cohort): in-hospital mortality was 18.8% for new or presumed new RBBB (highest of the four block groups, new/old × right/left), 13.2% for new LBBB, and 6.4% for old RBBB (lowest of the four); overall in-hospital mortality was similar for RBBB and LBBB. New (or presumed new) blocks, left or right, had the highest incidence of cardiogenic shock of all ECG subgroups. Among patients with acute left main occlusion, a subset also presented with RBBB (mostly with LAH) on the admission ECG.
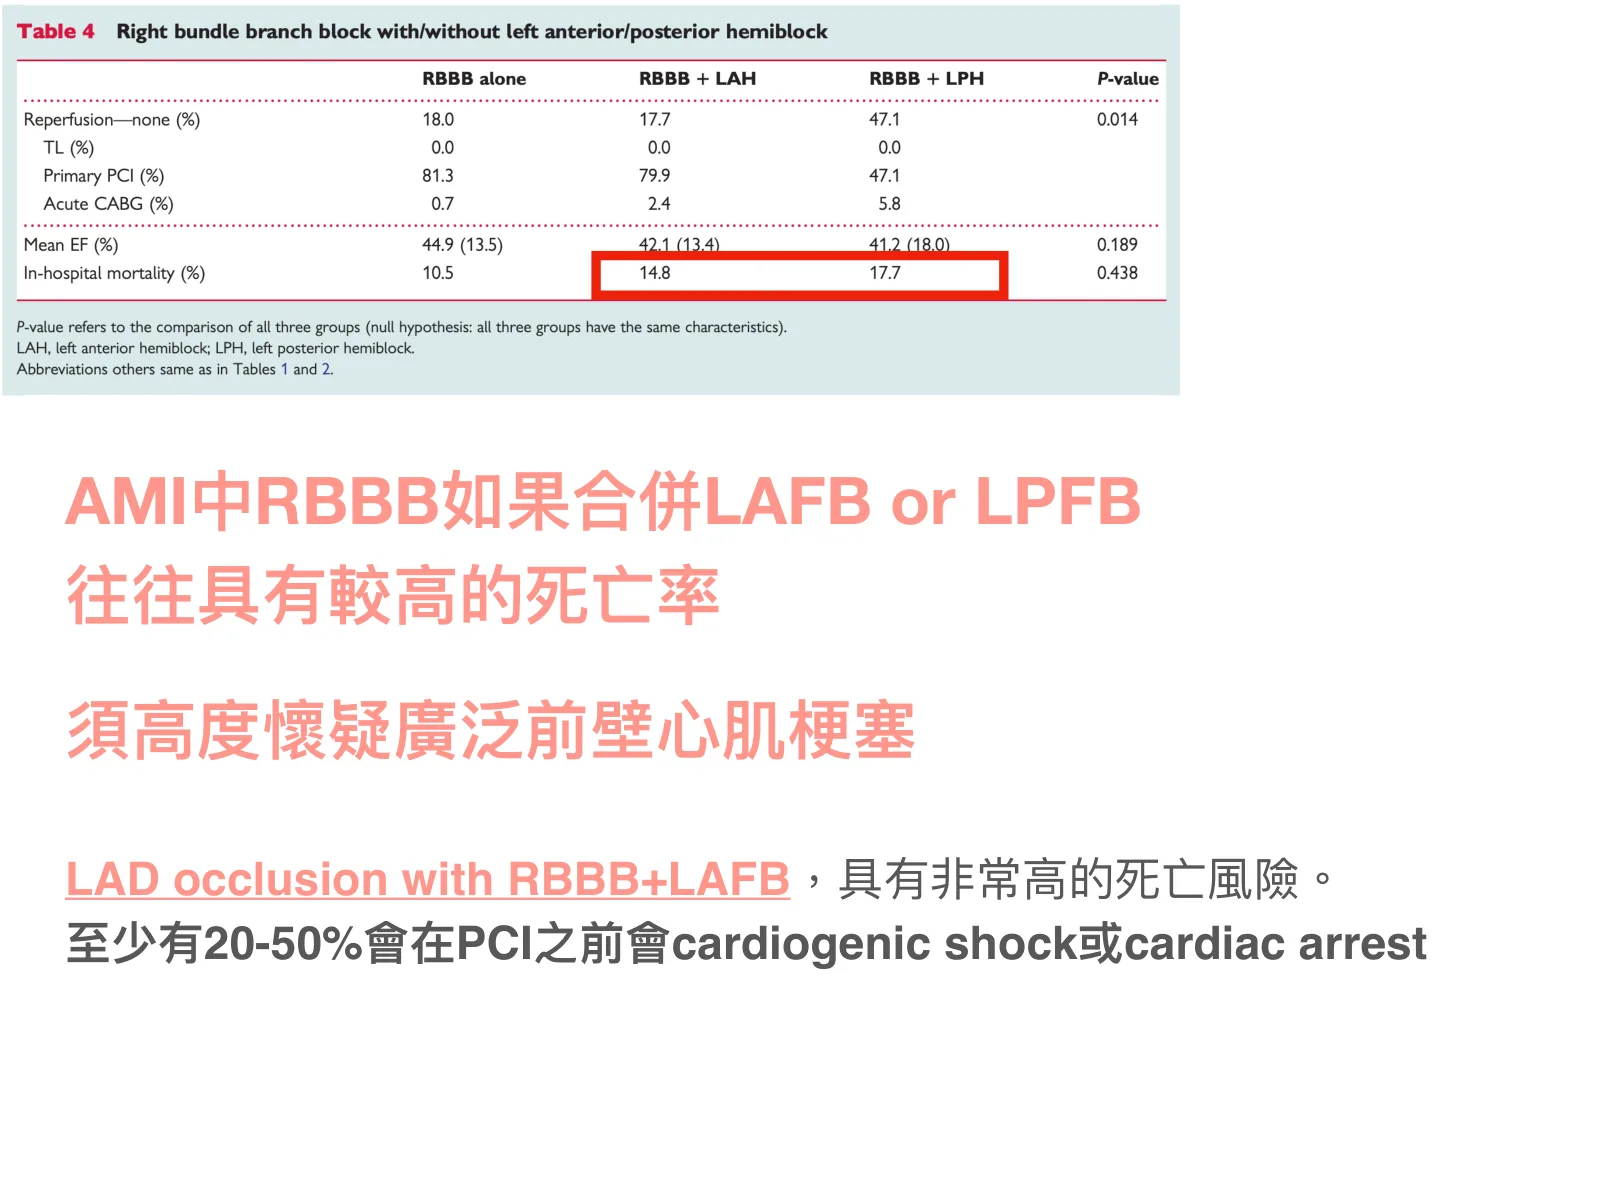
  • Same paper, Table 4 (RBBB with hemiblock): patients with RBBB plus LAH or LPH were older, had lower EF, and had more three-vessel disease, but mortality was only "slightly higher," and the comparison of in-hospital mortality across the three groups was not statistically significant; the RBBB+LPH group was very small, and its rate of receiving no reperfusion at all was clearly higher. So all you can say is "there's an upward trend," not "combined hemiblock has been proven to carry higher mortality."
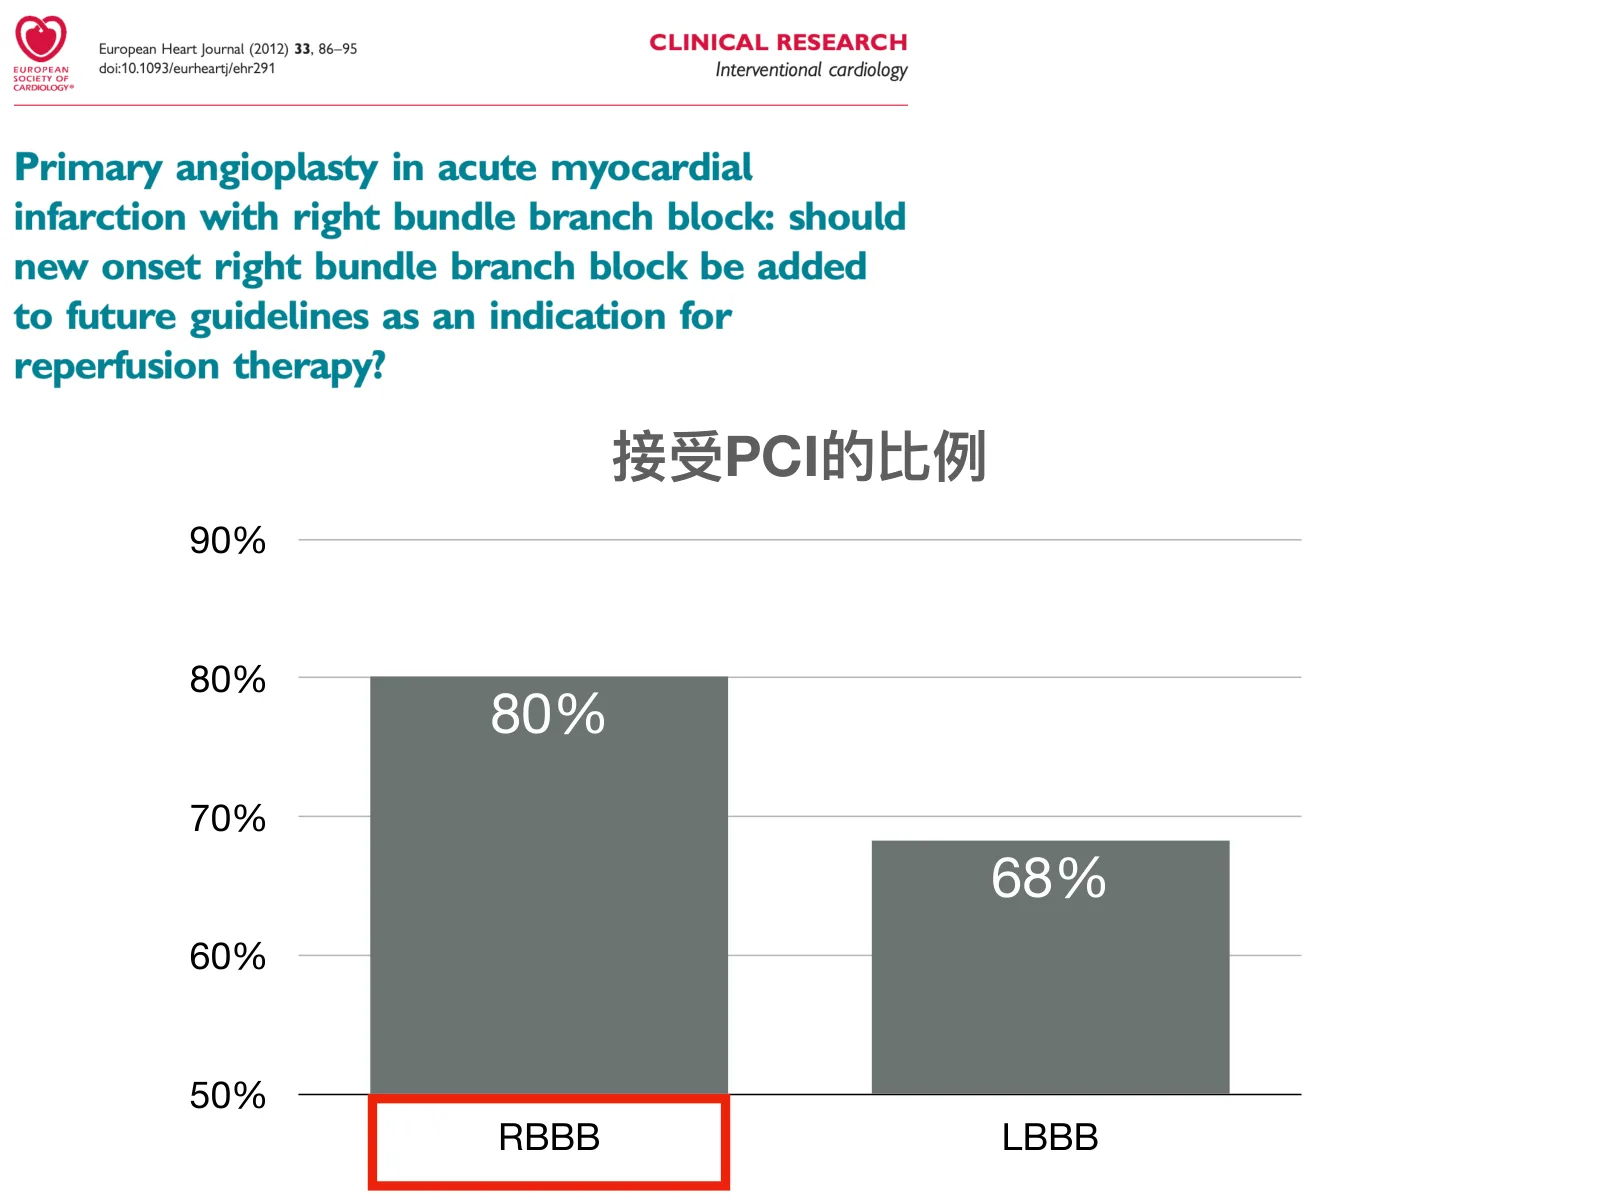
Top of the slide (in Chinese): a screenshot of the journal title page, European Heart Journal (2012) 33, 86–95, doi:10.1093/eurheartj/ehr291, titled "Primary angioplasty in acute myocardial infarction with right bundle branch block: should new onset right bundle branch block be added to future guidelines as an indication for reperfusion therapy?"; below, a bar chart redrawn from the paper's numbers, "Proportion receiving PCI," with the RBBB bar (circled in red) higher than LBBB.
From my 2025 ECG teaching slides for residents at Chi Mei Medical Center (slide 153); image: journal title page screenshot from Widimsky P, et al. Eur Heart J. 2012;33(1):86-95, bar chart redrawn from its numbers
Top of the slide: a screenshot of the journal table "Table 4 Right bundle branch block with/without left anterior/posterior hemiblock," with columns RBBB alone/RBBB+LAH/RBBB+LPH/P-value and a red box around the RBBB+LAH and RBBB+LPH cells in the In-hospital mortality row. Below are my takeaways in Chinese: in pink, "In AMI, if RBBB is combined with LAFB or LPFB," "it tends to carry higher mortality," "strongly suspect extensive anterior MI"; in dark gray, "LAD occlusion with RBBB+LAFB carries a very high risk of death," plus a sentence estimating the proportion who develop cardiogenic shock or cardiac arrest before PCI.
From my 2025 ECG teaching slides for residents at Chi Mei Medical Center (slide 155); the table screenshot at the top is from Widimsky P, et al. Eur Heart J. 2012;33(1):86-95 (Table 4). ⚠️ The differences in in-hospital mortality among the three groups in the table are not statistically significant (see the P-value in the far-right column), so the slide's "higher mortality" should be read only as a trend; the shock/arrest proportion in the last sentence is a personal clinical-experience estimate from Dr. Smith's blog (original: "I would estimate in my experience"), not a result from a study.

Sources

  1. Widimsky P, Rohác F, Stásek J, Kala P, Rokyta R, et al. Primary angioplasty in acute myocardial infarction with right bundle branch block: should new onset right bundle branch block be added to future guidelines as an indication for reperfusion therapy? Eur Heart J. 2012 Jan;33(1):86-95. PMID 21890488
  2. Pozen JM, Mankad AK, Owens JT, Jovin IS. New Right Bundle Branch Block as a Criterion for Emergent Coronary Angiography. N Am J Med Sci. 2015;7(12):569-571
  3. Dr. Smith's ECG Blog (Pendell Meyers). A man in his 50s with acute chest pain. See what happens when it is "Not a STEMI". 2026-07-13
  4. Dr. Smith's ECG Blog (Steve Smith & Pendell Meyers). How does Acute Total Left Main Coronary occlusion present on the ECG? 2019-08-09
  5. Dr. Smith's ECG Blog (Pendell Meyers). Cardiac Arrest at the airport, with an easy but important ECG for everyone to recognize. 2021-09-23 (original source of the clinical-experience estimate on slide 155)
  6. LITFL (Ed Burns, Robert Buttner). Anterior Myocardial Infarction. ECG Library Diagnosis
  7. Horton CL, Brady WJ. Right bundle-branch block in acute coronary syndrome: diagnostic and therapeutic implications for the emergency physician. Am J Emerg Med. 2009 Nov;27(9):1130-41. PMID 19931763
  8. LITFL (Ed Burns, Robert Buttner). Right Bundle Branch Block (RBBB). ECG Library Diagnosis
  9. LITFL (Ed Burns, Robert Buttner). ECG changes in Pulmonary Embolism. ECG Library
  10. Mills NL, Newby LK, Zaman S, et al. Fifth Universal Definition of Myocardial Infarction (2026). Glob Heart. 2026;21:64. DOI 10.5334/gh.1578, §13 (lists new or presumed new RBBB/LBBB combined with other signs of ischemia as equivalent to STEMI; the reference cited for that sentence, 144, is Widimsky 2012)

Based on STD

STDmaxV1-4 indicative of Post.OMI

▶ Animation 1:15

Maximal STD in V1–V4 ➜ STDmaxV1-4. Posterior OMI until proven otherwise. Get posterior leads.

  • STDmaxV1-4: ischemic STD in the precordial leads (V1–V6), with the maximal STD in one of V1, V2, V3, or V4 (relative to V5 and V6). The point isn't "how deep," it's "which lead is deepest."
  • The mechanism is vectors: posterior OMI is the mirror image of transmural STE on the opposite (posterior) wall, projecting as STD in V1–V4; the summed STD of diffuse subendocardial ischemia points toward the apex (V5, V6). When you see STDmaxV1-4, treat it as posterior OMI until proven otherwise.
  • The precordial QRS/T waves have four bonus clues: horizontal (not upsloping) STD, a dominant R wave in V2 (R/S ratio > 1), a broad R wave (> 30 ms), and upright T waves in V1–V4; these are all what the posterior "mirror image" looks like flipped over. You can use Ken Grauer's "Mirror Test": flip V1–V3 upside down and see whether it turns into an anterior STEMI you'd recognize.

Criteria

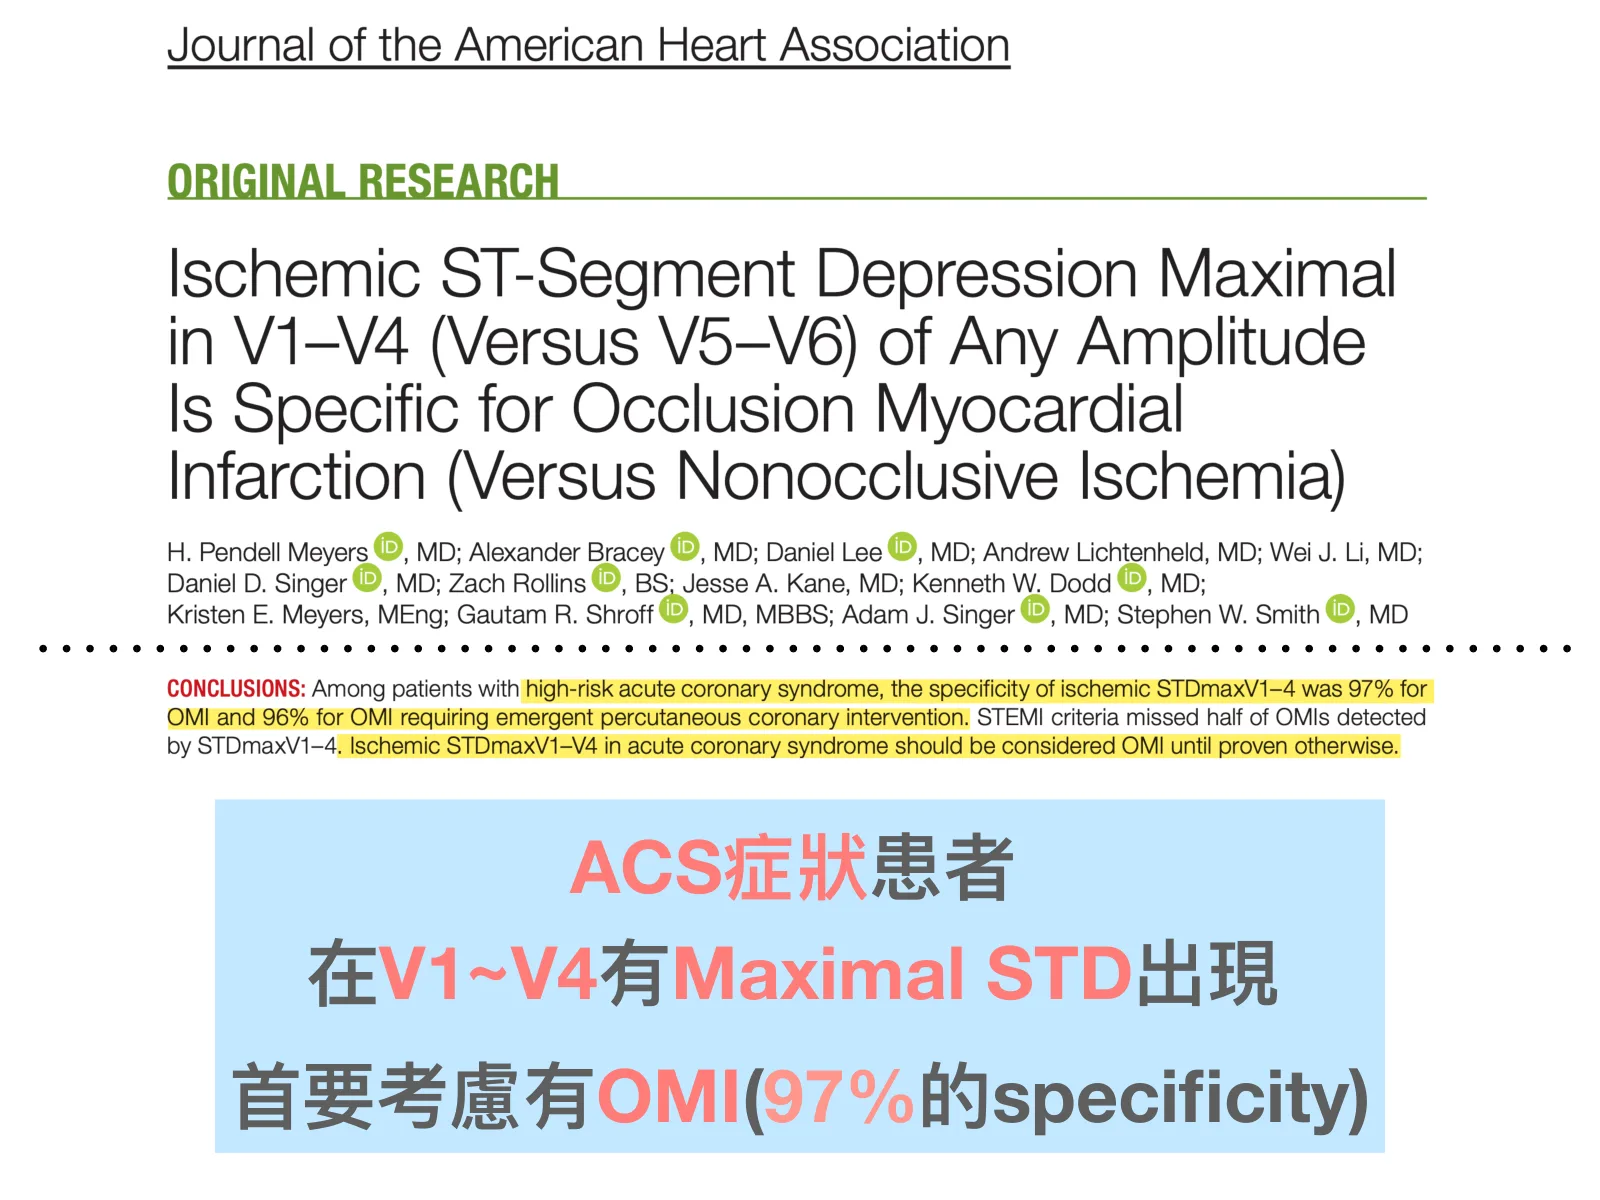
  • Ischemic STDmaxV1-4 had 97% specificity for OMI (Meyers 2021, 808 high-risk ACS patients). The paper's title says "of Any Amplitude": this finding has no "how deep does it have to be" threshold; STDmaxV1-4 under 1 mm carries specificity too.
  • The STE threshold for posterior leads V7–V9 is 0.5 mm, not 1 mm. The AHA/ACCF/HRS 2009 recommendations for standardization of ECG interpretation explicitly set the V7–V9 threshold at 0.05 mV (0.5 mm); the latest Fifth UDMI (2026) only says to confirm with STE in V7–V9 and gives no number. So in practice, keep using it, but don't call it "required by the latest guideline."

Teaching animation

STDmax V1–V4

indicative of posterior OMI

Precordial STD deepest in V1–V4 should make you highly suspect posterior OMI (specificity 97%)

▶ 1:15 ECG Animations

References
  • Baltazar, Basic & Bedside Electrocardiography
  • Critical Cases in Electrocardiography
  • Critical Decisions in Emergency and Acute Care Electrocardiography
  • Grauer, ECG Pocket Brain
  • Sparkson, Illustrated Guide to ECG 2e
  • Hanna, Practical Cardiovascular Medicine
  • Roberts & Hedges' Clinical Procedures
  • Dr. Smith's ECG Blog
  • ECG Weekly
  • LITFL
  • Meyers HP, et al. J Am Heart Assoc 2021
  • REBEL EM
  • AHA/ACCF/HRS 2009 Part VI
  • Fourth UDMI 2018
Top of the slide: a screenshot of the first page of the JAHA paper, titled "Ischemic ST-Segment Depression Maximal in V1–V4 (Versus V5–V6) of Any Amplitude Is Specific for Occlusion Myocardial Infarction (Versus Nonocclusive Ischemia)," with 13 authors listed, starting with Meyers; the CONCLUSIONS paragraph, highlighted in yellow, gives 97%/96% specificity. Below, a light blue block with my own takeaways in Chinese: "Patients with ACS symptoms, maximal STD in V1~V4: consider OMI first (97% specificity)"
From my 2025 ECG teaching slides for residents at Chi Mei Medical Center (slide 170); image: Meyers HP, et al. J Am Heart Assoc. 2021
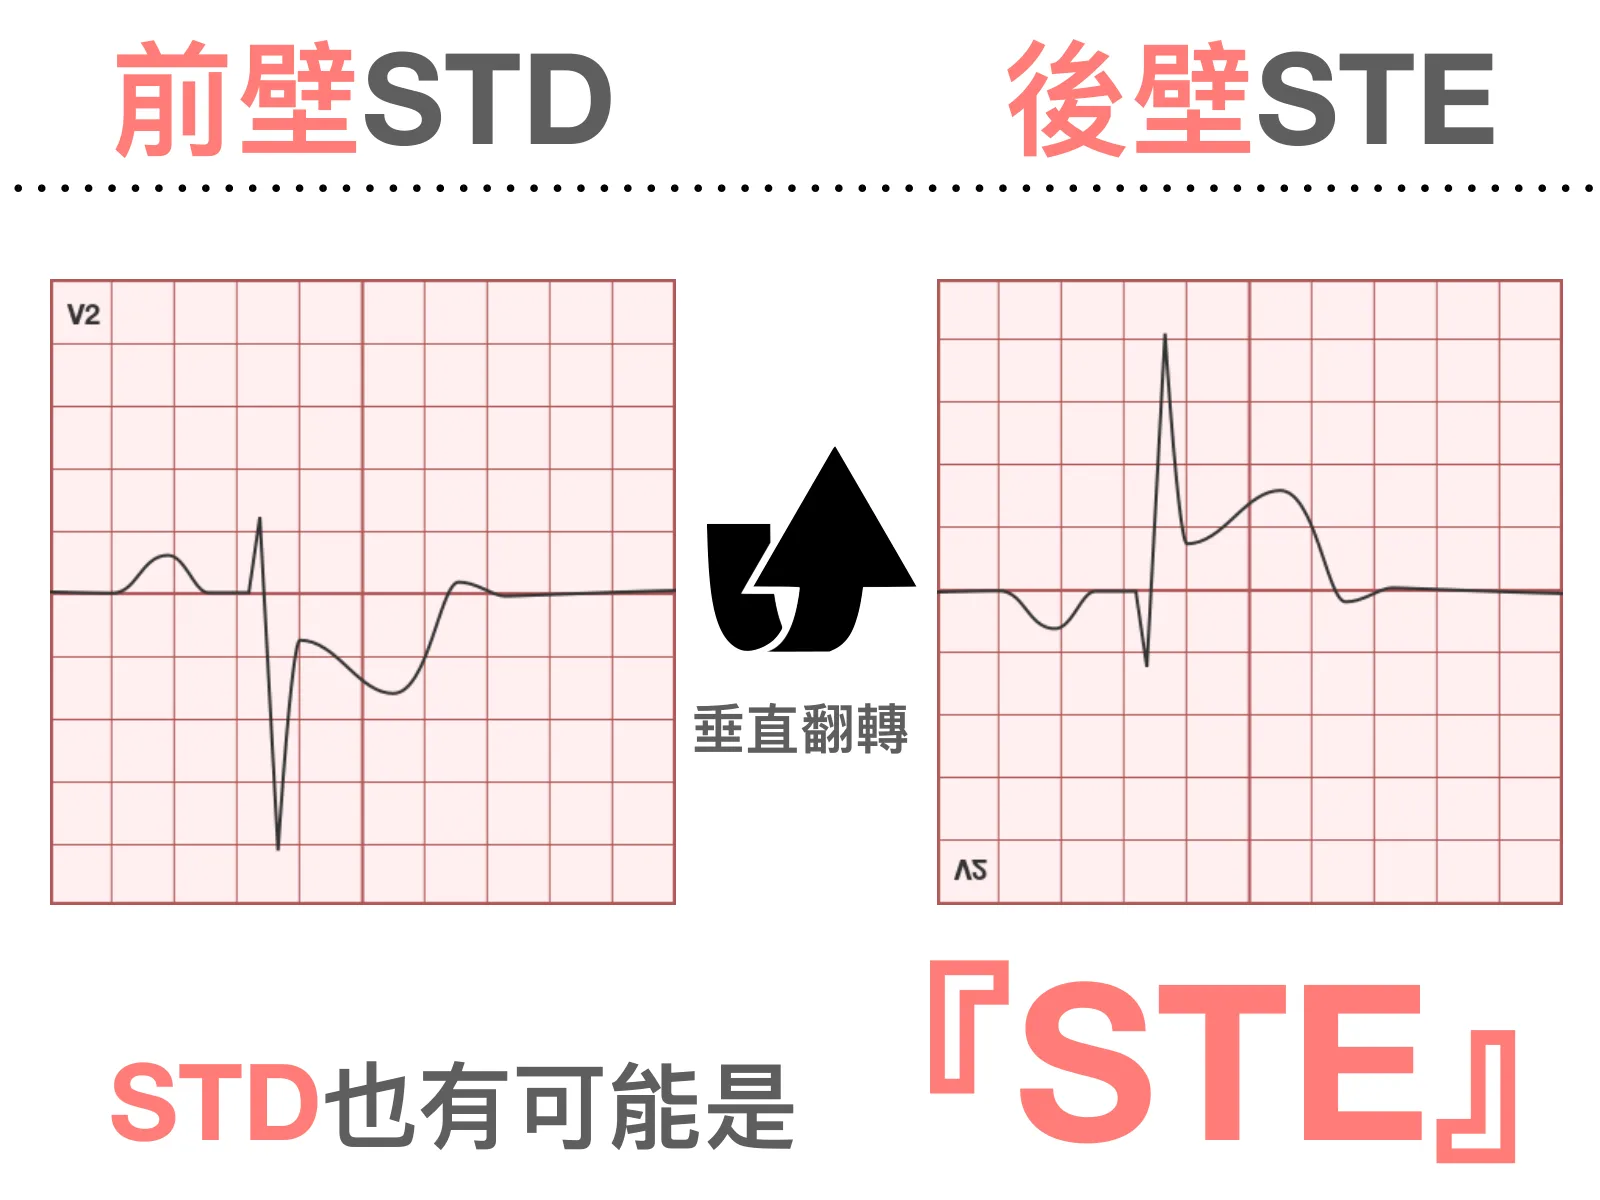
Slide (in Chinese) with two V2 lead sketches side by side: the left one, titled "Anterior STD," has the ST segment pushed down after the QRS; the right one, titled "Posterior STE," is the same waveform flipped upside down, so the ST segment is now elevated. A black arrow in the middle reads "flip vertically," and large text at the bottom says "STD can also be 'STE'."
From my 2022 ECG teaching slides for residents at Taipei Veterans General Hospital (slide 83): flip anterior STD upside down and you get posterior STE.

Sources

  1. Meyers HP, Bracey A, Lee D, et al. Ischemic ST-Segment Depression Maximal in V1-V4 (Versus V5-V6) of Any Amplitude Is Specific for Occlusion Myocardial Infarction (Versus Nonocclusive Ischemia). J Am Heart Assoc. 2021 Dec 7;10(23):e022866. PMID 34775811.
  2. Shah A, Wagner GS, Green CL, et al. Electrocardiographic differentiation of the ST-segment depression of acute myocardial injury due to the left circumflex artery occlusion from that of myocardial ischemia of nonocclusive etiologies. Am J Cardiol. 1997 Aug 15;80(4):512-3. PMID 9285669.
  3. Wung SF, Drew BJ. New electrocardiographic criteria for posterior wall acute myocardial ischemia validated by a percutaneous transluminal coronary angioplasty model of acute myocardial infarction. Am J Cardiol. 2001 Apr 15;87(8):970-4. PMID 11305988.
  4. Wagner GS, Macfarlane P, Wellens H, et al. AHA/ACCF/HRS recommendations for the standardization and interpretation of the electrocardiogram: part VI: acute ischemia/infarction. Circulation. 2009 Mar 17;119(10):e262-70. PMID 19228819.
  5. Poh KK, Chia BL, Tan HC, Yeo TC, Lim YT. Absence of ST elevation in ECG leads V7, V8, V9 in ischaemia of non-occlusive aetiologies. Int J Cardiol. 2004 Dec;97(3):389-92. PMID 15561323.
  6. Dr. Smith's ECG Blog (by Pendell Meyers): A man in his early 40s with chest pain: STD in V1-V4, but posterior lead are negative (2021-02-14)
  7. Dr. Smith's ECG Blog (Steve Smith): A 50-something male with Dyspnea (2015-03-02)
  8. REBEL EM (Salim Rezaie): Posterior Occlusion Myocardial Infarctions and STDmaxV1-4 (2021-12-09)
  9. LITFL: Posterior Myocardial Infarction (last updated 2024-10-23)
  10. LITFL: The ST Segment (last updated 2024-10-08)
  11. Lizzo JM, Shams P. Posterior Myocardial Infarction. StatPearls (last update 2025-12-01)

Based on STD

aVR STE + multiple leads STD

STE, and it's in aVR (+ multiple leads STD) ➜ this is that wastebasket. Everything is in there, but for a sick patient, call CV and talk it through together.

  • aVR STE is itself a mirror: there's no ventricular myocardium under aVR (Smith's version), or it faces the basal septum (the Mattu/LITFL version). The two camps differ on the anatomy but reach the same conclusion: that STE isn't the artery under it being occluded; it's the mirror image of a bunch of STD elsewhere. You can think of aVR as (−)aVR: with STD in I and II, (−)aVR mathematically has to have STD, so (+)aVR has to have STE.
  • The conclusion deserves to be said loudly: aVR STE + diffuse STD is not left main occlusion, and it's not OMI; it's diffuse subendocardial ischemia (supply/demand mismatch). Patients with a true 100% left main occlusion usually don't make it to you: the patient who walks into the ED, alert, holding this ECG is there precisely because their left main "isn't completely occluded yet."
  • This pattern has high mortality, but the mechanism isn't a single occluded artery; it's "the whole heart globally short on oxygen." It may be ACS (left main insufficiency, all three vessels bad, proximal LAD), or not ACS at all (sepsis, severe anemia, GI bleeding, hypoxia, SVT/AF RVR, hypovolemia, aortic stenosis, hypertensive emergency). The first step isn't picking up the phone; it's finding and correcting the supply/demand cause. After correcting it, get another ECG; if the STD is still there and the patient is still in pain (or the chest pain is refractory, or the blood pressure is dropping), talk with CV.

Criteria

  • Among patients with STE-aVR + multilead STD, a coronary occlusion thought to be culprit was found in only 10%, and none of those lesions were left main or LAD occlusions (Harhash 2019).

Sources

  1. Harhash AA, Huang JJ, Reddy S, et al. aVR ST Segment Elevation: Acute STEMI or Not? Incidence of an Acute Coronary Occlusion. Am J Med. 2019 May;132(5):622-630. PMID 30639554.
  2. Dr. Smith's ECG Blog (Steve Smith): Does ST Elevation in lead aVR indicate acute coronary occlusion? (2020-03-09)
  3. Dr. Smith's ECG Blog (co-written by Steve Smith and Pendell Meyers): How does Acute Total Left Main Coronary occlusion present on the ECG? (2019-08-09)
  4. LITFL: ST Elevation in aVR (last updated 2024-10-08)

Based on STD

Reciprocal STD change and/or TWI

Inferior or lateral STD/TWI, mirroring an STE somewhere ➜ Reciprocal STD / TWI. Reciprocal change is often more obvious than the STE itself.

  • The STD in this finding isn't the answer itself; it's a witness for "a subtle STE in another lead": a subtle STE plus reciprocal STD/TWI in the opposite lead goes from "something's off" to "diagnostic."
  • Remember two things first (the words on my own slide): reciprocal change may appear before the STE, and it may be more obvious than the STE. One mechanism is low voltage: in someone whose QRS is small to begin with, STE that's proportional to the QRS will be less obvious too, but the STD of reciprocal change isn't limited that way and may actually stand out more. So in these patients you often see the STD first and the STE after; that STD is pointing the way for you.
  • Memorize the opposite-wall relationships: STD in V1–V4 → think posterior (see STDmaxV1-4); STD in I/aVL → think inferior (II/III/aVF); STD in II/III/aVF → think high lateral (I/aVL); STD in V5–V6 with STE in V1 → think septal (see Precordial Swirl). Lead III and aVL have a "magical" mirror-image relationship: proximal LAD occlusion almost always has reciprocal STD in the inferior leads; mid/distal LAD occlusion doesn't necessarily.

Criteria

  • Bischof 2016: all 154 inferior STEMIs (100%) had some degree of STD in aVL; subtle inferior STEMIs, with small STE not yet meeting STEMI criteria but with occlusion confirmed at cath (54 patients), also had STD in aVL in 91%.
  • What doesn't count as reciprocal change: if the QRS in that lead is itself predominantly negative (e.g., aVL when the frontal plane axis is very vertical), a T wave that follows it shallowly downward is a normal variant, not reciprocal change; true reciprocal TWI is disproportionately bulky relative to the size of the negative QRS.
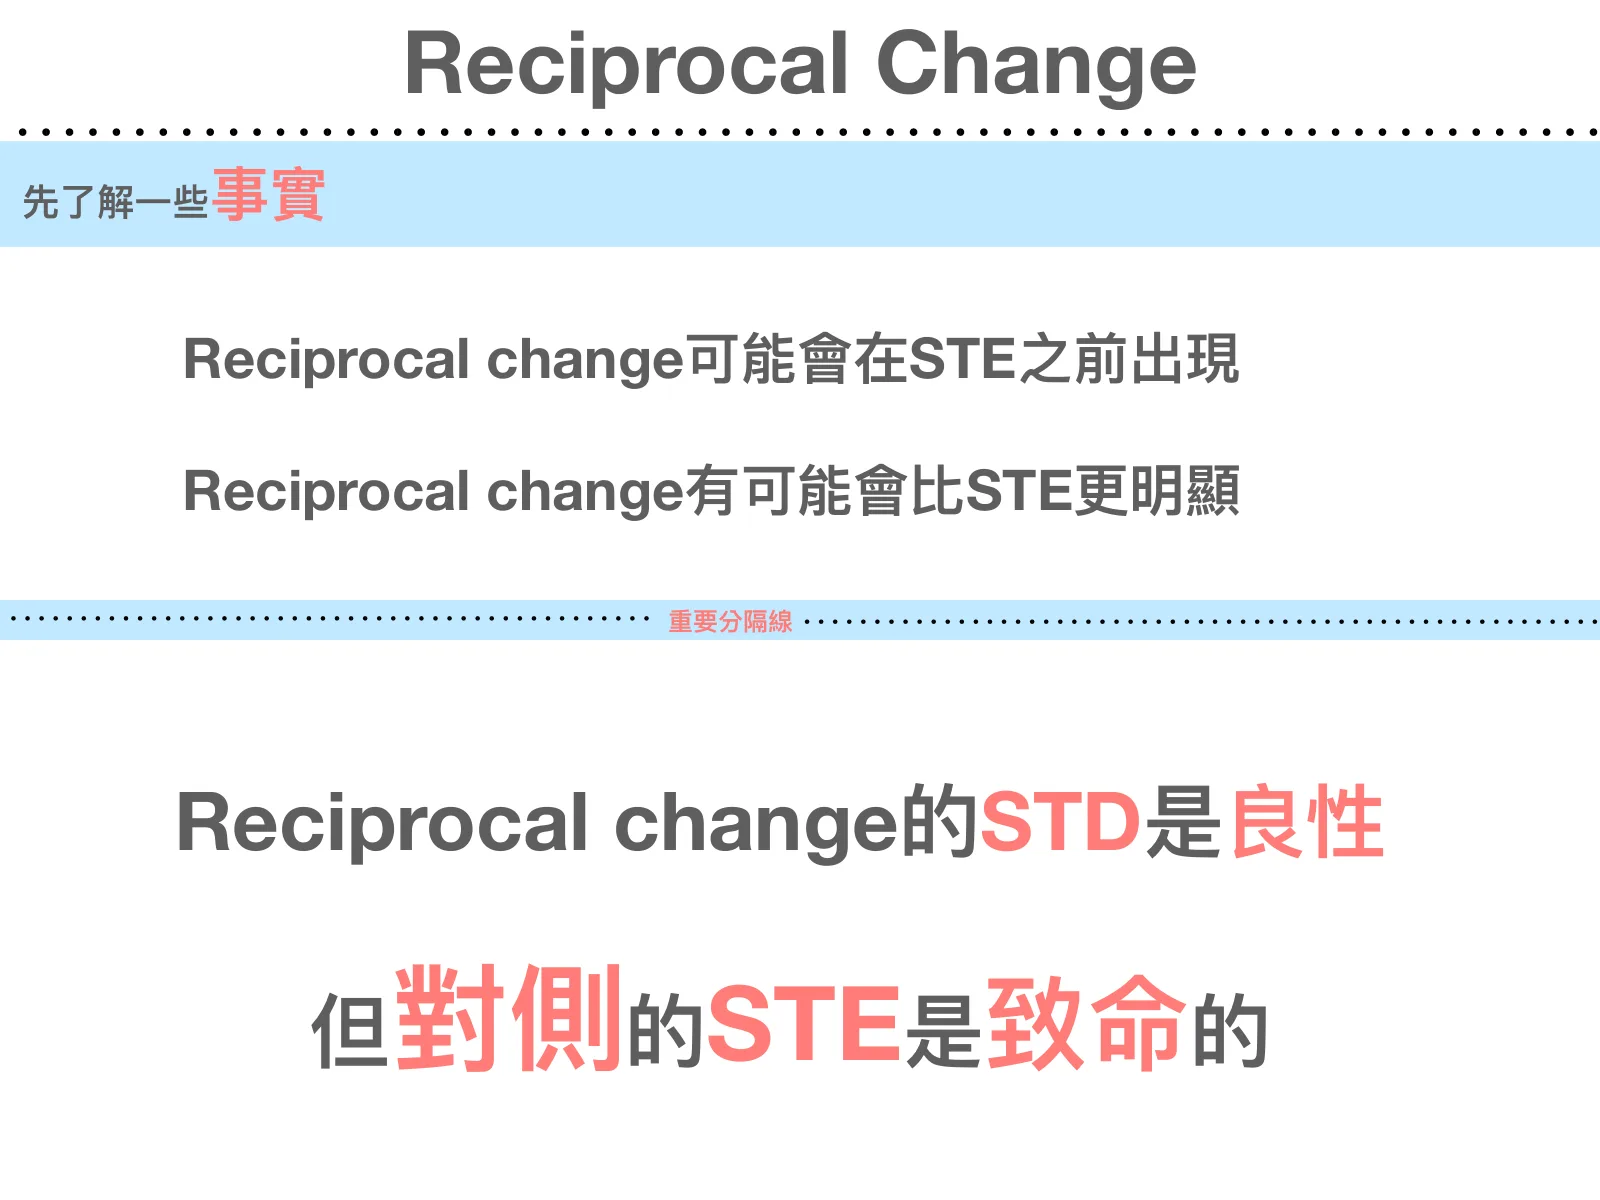
Slide (in Chinese) titled "Reciprocal Change": a light blue bar at the top, "First, some facts," with text below: "Reciprocal change may appear before the STE," "Reciprocal change may be more obvious than the STE"; a thin light blue bar in the middle, "Important dividing line," and large text below it: "The STD of reciprocal change is benign," "but the STE on the opposite side is lethal." Text only, no images.
From my 2021 ECG teaching slides for residents at Shin Kong Wu Ho-Su Memorial Hospital (slide 16)

Sources

  1. Bischof JE, Worrall C, Thompson P, Marti D, Smith SW. ST depression in lead aVL differentiates inferior ST-elevation myocardial infarction from pericarditis. Am J Emerg Med. 2016 Feb;34(2):149-54. PMID 26542793.
  2. Pallin DJ. Beware of ST Depression in ECG Lead aVL. NEJM Journal Watch (2016-02-26)
  3. Fletcher WO, Gibbons RJ, Clements IP. The relationship of inferior ST depression, lateral ST elevation, and left precordial ST elevation to myocardium at risk in acute anterior myocardial infarction. Am Heart J. 1993 Sep;126(3 Pt 1):526-35. PMID 8362705.
  4. LITFL: Inferior STEMI (last updated 2024-10-08)
  5. Ken Grauer, ECG Blog #426 — Are STEMI Criteria Met? (2024-04-20)
  6. Dr. Smith's ECG Blog (Steve Smith, with Ken Grauer's comment): A 30-something with acute chest pain (2024-10-03)
  7. Dr. Smith's ECG Blog (with Ken Grauer's comment): A 58 year old with Weakness and more than 4 mm ST Elevation in V3 (2018-08-09)

Based on STD

Precordial Swirl

⭐️ New in 2025

STE or a disproportionately upright T in V1 (±V2) + reciprocal STD/TWI in V5–V6 ➜ Precordial Swirl. Think occlusion of the proximal LAD, before the septal branch.

  • The definition formally published in 2025 (Goss et al.): STE and/or hyperacute T waves in V1-V2, with reciprocal STD and/or TWI in V5-V6, forming a "clockwise swirl" across the precordial leads. Mechanism: if the LAD is occluded before the first septal perforator (S1), even the whole septum becomes transmurally ischemic; the septum sits right and anterior, so the injury vector projects onto V1 (and aVR) as STE, while the apex and lateral wall sit at the other end of the vector, so V5 and V6 get reciprocal STD.
  • How to look: first V1. Does the ST-T "not look the way it should" (disproportionate STE/disproportionately upright T/coved shape)? The paper's quantitative version is a V2 T-wave amplitude ÷ S-wave amplitude > 0.40. Then V6: is there STD? Is that STD a "flat shelf" rather than the "downsloping" LVH strain kind? Is the T wave still upright (classic swirl is flat STD with an upright T)?
  • Telling it apart from aVR STE + multiple leads STD (diffuse subendocardial ischemia) is just a matter of which is taller: aVR STE > V1 STE → think subendocardial ischemia/left main/3-vessel; V1 STE > aVR STE → think precordial swirl/proximal LAD occluded before S1. This is a reading trick, not a criterion with sens/spec numbers; use it as a clue, not as the only reason.

Criteria

  • One of the definitions tested in Goss 2025 (the looser version): normal QRS (narrow QRS and no LVH) + STD in V5 and/or V6 + any STE in V1 and/or V2. "No LVH" is written into the definition as an exclusion criterion, not a caveat at the end of the paper; co-author Meyers said on Dr. Smith's ECG Blog (2025-08-18) that LVH and subendocardial ischemia are the two most common mimics of this pattern.
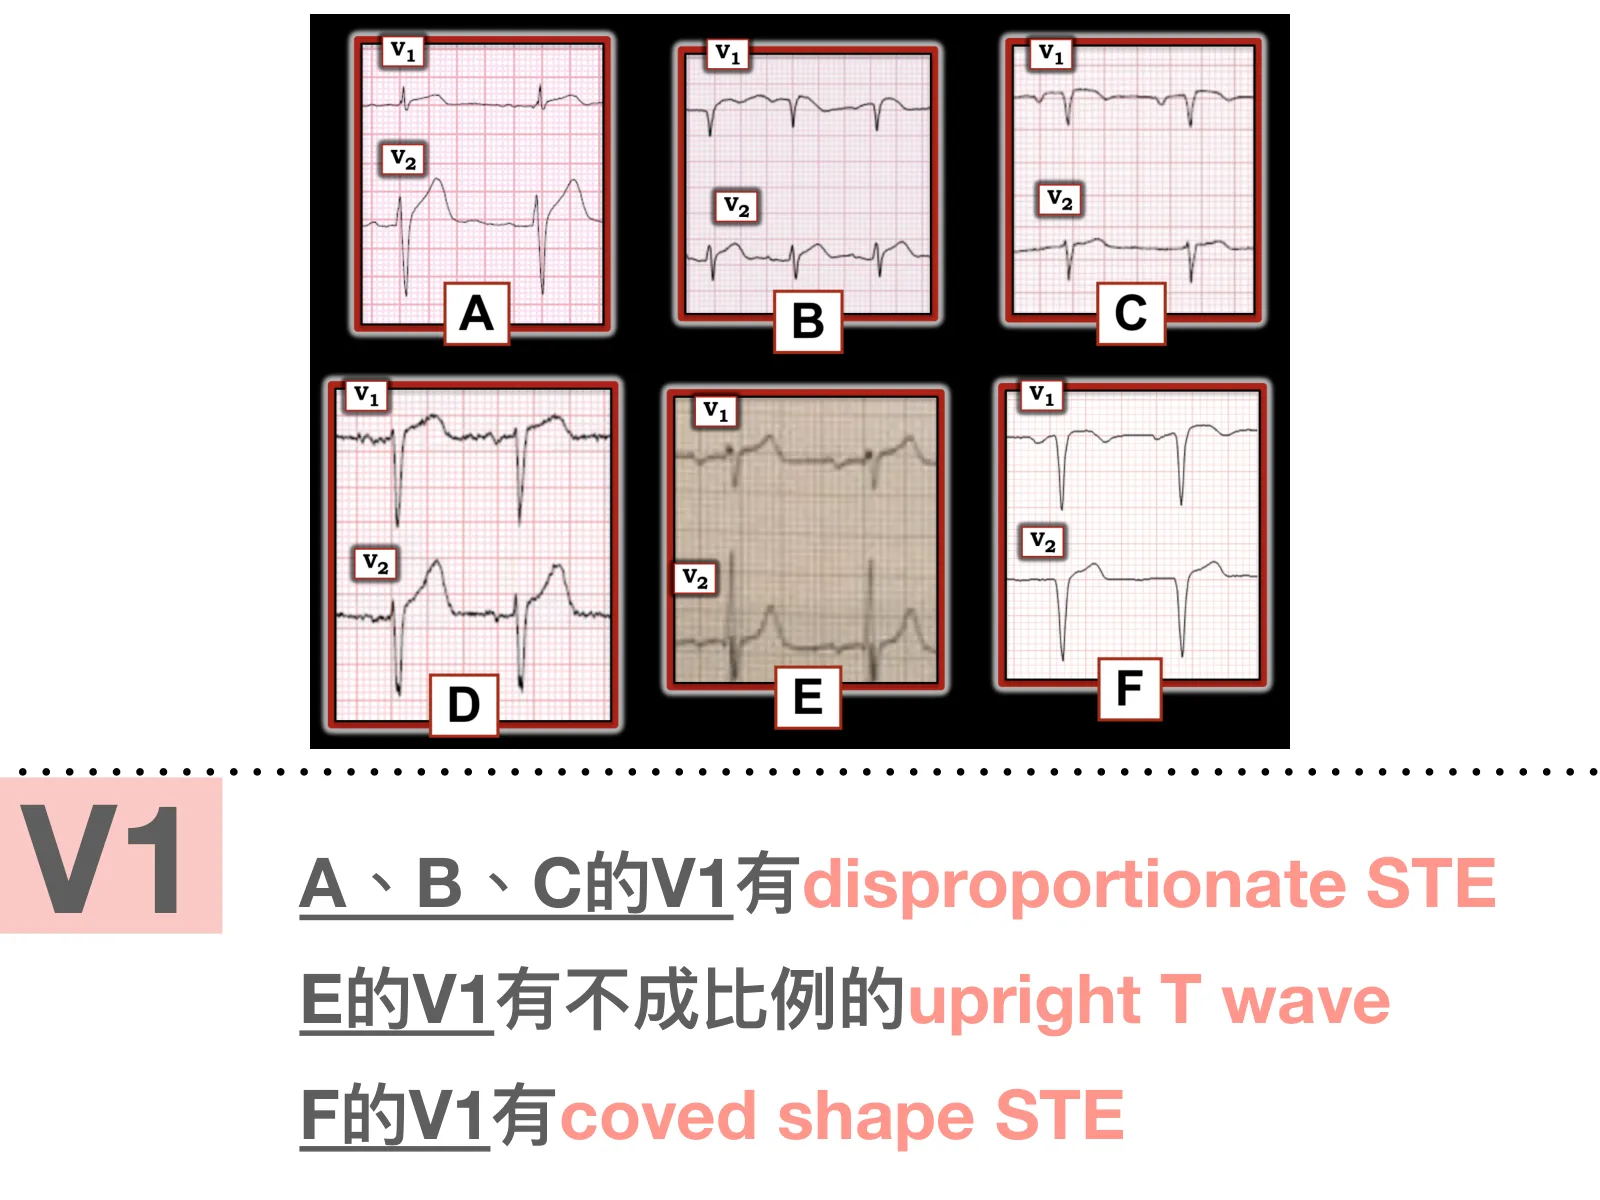
Top of the slide: six panels of V1/V2 ECGs (black background, red frames, labeled A to F; a figure compiled by Ken Grauer); below, large pink text "V1"; on the right, text: "V1 in A, B, C has disproportionate STE," "V1 in E has a disproportionately upright T wave," "V1 in F has coved-shape STE."
From my 2025 ECG teaching slides for residents at Chi Mei Medical Center (slide 226); the six V1/V2 panels at the top: Figure-1 compiled by Ken Grauer, from his comment on Dr. Smith's ECG Blog post "Precordial Swirl — 20 cases of Swirl or Look-Alikes" (2022-10-15), with ECGs from the cases Dr. Smith provided in that post

Sources

  1. Goss L, Meyers HP, Friedman B, Bracey A, Smith SW. Precordial swirl sign: A new ECG pattern of left anterior descending artery occlusion myocardial infarction. J Electrocardiol. 2025 Jul-Aug;91:153931. PMID 40319770.
  2. Dr. Smith's ECG Blog (Steve Smith, with Ken Grauer's MY Comment): Precordial Swirl — 20 cases of Swirl or Look-Alikes (2022-10-15)
  3. Ken Grauer, ECG Blog #380 — What is "Swirl"? (2023-05-20)
  4. Dr. Smith's ECG Blog (by Pendell Meyers): A man in his 60s with acute chest pain. Is this precordial swirl? (2025-08-18)
  5. Farkas J. ECG Guide (Precordial swirl pattern section). Internet Book of Critical Care (IBCC), EMCrit (2026-05-07)

Special patterns

TQRSD

Terminal QRS Distortion

▶ Animation 1:07

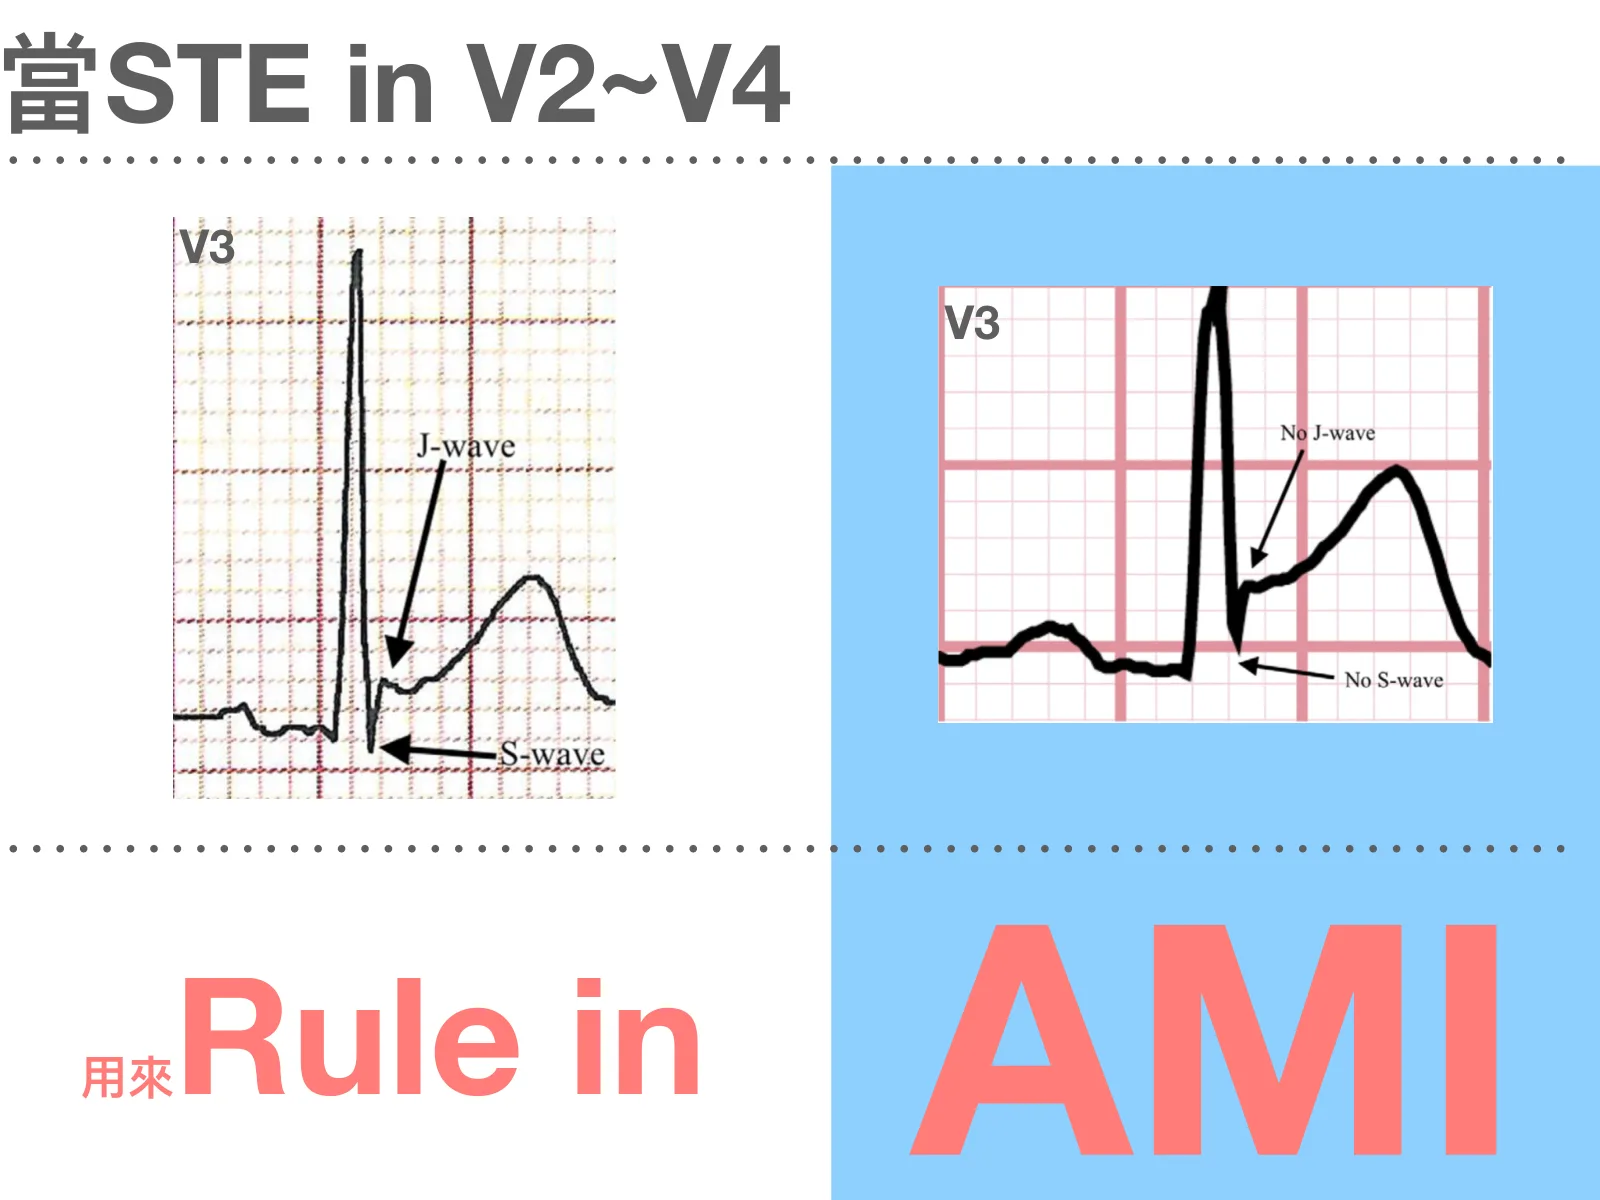
If V2 or V3 has no S wave and no J wave at the same time ➜ treat it as OMI outright, no calculation needed.

  • TQRSD = in either V2 or V3, the S wave and the J wave are both gone. Note it's "or," not "and": if either V2 or V3 has no S wave and no J wave at the same time, it counts.
  • TQRSD is a rule-in tool, not a rule-out tool. No TQRSD does not mean, in any way, that it isn't OMI.

Criteria

  • S wave = any deflection at the end of the R wave that dipped below the level of the PQ junction; J wave = any positive deflection (notching or slurring) above the level of the ST segment at the J point.
  • Of 171 patients read by cardiologists as benign early repolarization, 0 had TQRSD: specificity for LAD occlusion 100% (95% CI 97.8–100). But this 100% comes with a condition: the paper says it holds when the differential diagnosis is acute MI vs early repolarization, not an unconditional 100%.

Teaching animation

TQRSD

Terminal QRS distortion

V2 or V3: no S wave and no J wave. When the tail is gone, that's the warning sign

▶ 1:07 ECG Animations

References
  • Lee, Walsh, Smith. Am J Emerg Med 2016
  • ECG Weekly
  • Critical Decisions in Emergency and Acute Care Electrocardiography
Slide titled "When STE in V2~V4" (in Chinese): on the left, a journal figure of V3 in benign early repolarization, with arrows marking the J-wave and S-wave; on the right, on a blue background, another journal figure of V3 in TQRSD, with arrows marking No J-wave and No S-wave. Bottom left, red text: "Used to Rule in"; bottom right, large red text on blue: "AMI".
From my 2025 ECG teaching slides for residents at Chi Mei Medical Center (slide 252); both V3 tracings are from Lee DH, Walsh B, Smith SW. Am J Emerg Med. 2016;34(11):2182-2185 (left: Fig. 2, right: Fig. 1)

Sources

  1. Lee DH, Walsh B, Smith SW. Terminal QRS distortion is present in anterior myocardial infarction but absent in early repolarization. Am J Emerg Med. 2016 Nov;34(11):2182-2185. PMID 27658331.
  2. emDocs: 52 in 52 – #15: Terminal QRS distortion is present in anterior myocardial infarction but absent in early repolarization (Christiaan van Nispen, Brannon Inman, 2022-10-11)
  3. The Bottom Line: Terminal QRS distortion (David Slessor, 2022-02-25)
  4. ECG Weekly: Differential Diagnoses: terminal QRS distortion in the differentiation of STEMI from early repolarization (Dr. Amal Mattu, 2019-08-12; full text requires subscription)
  5. Ken Grauer, ECG Blog #415 — The Cath showed NO Occlusion! (2024-02-04)

Special patterns

Wellens' syndrome

▶ Animation 1:24

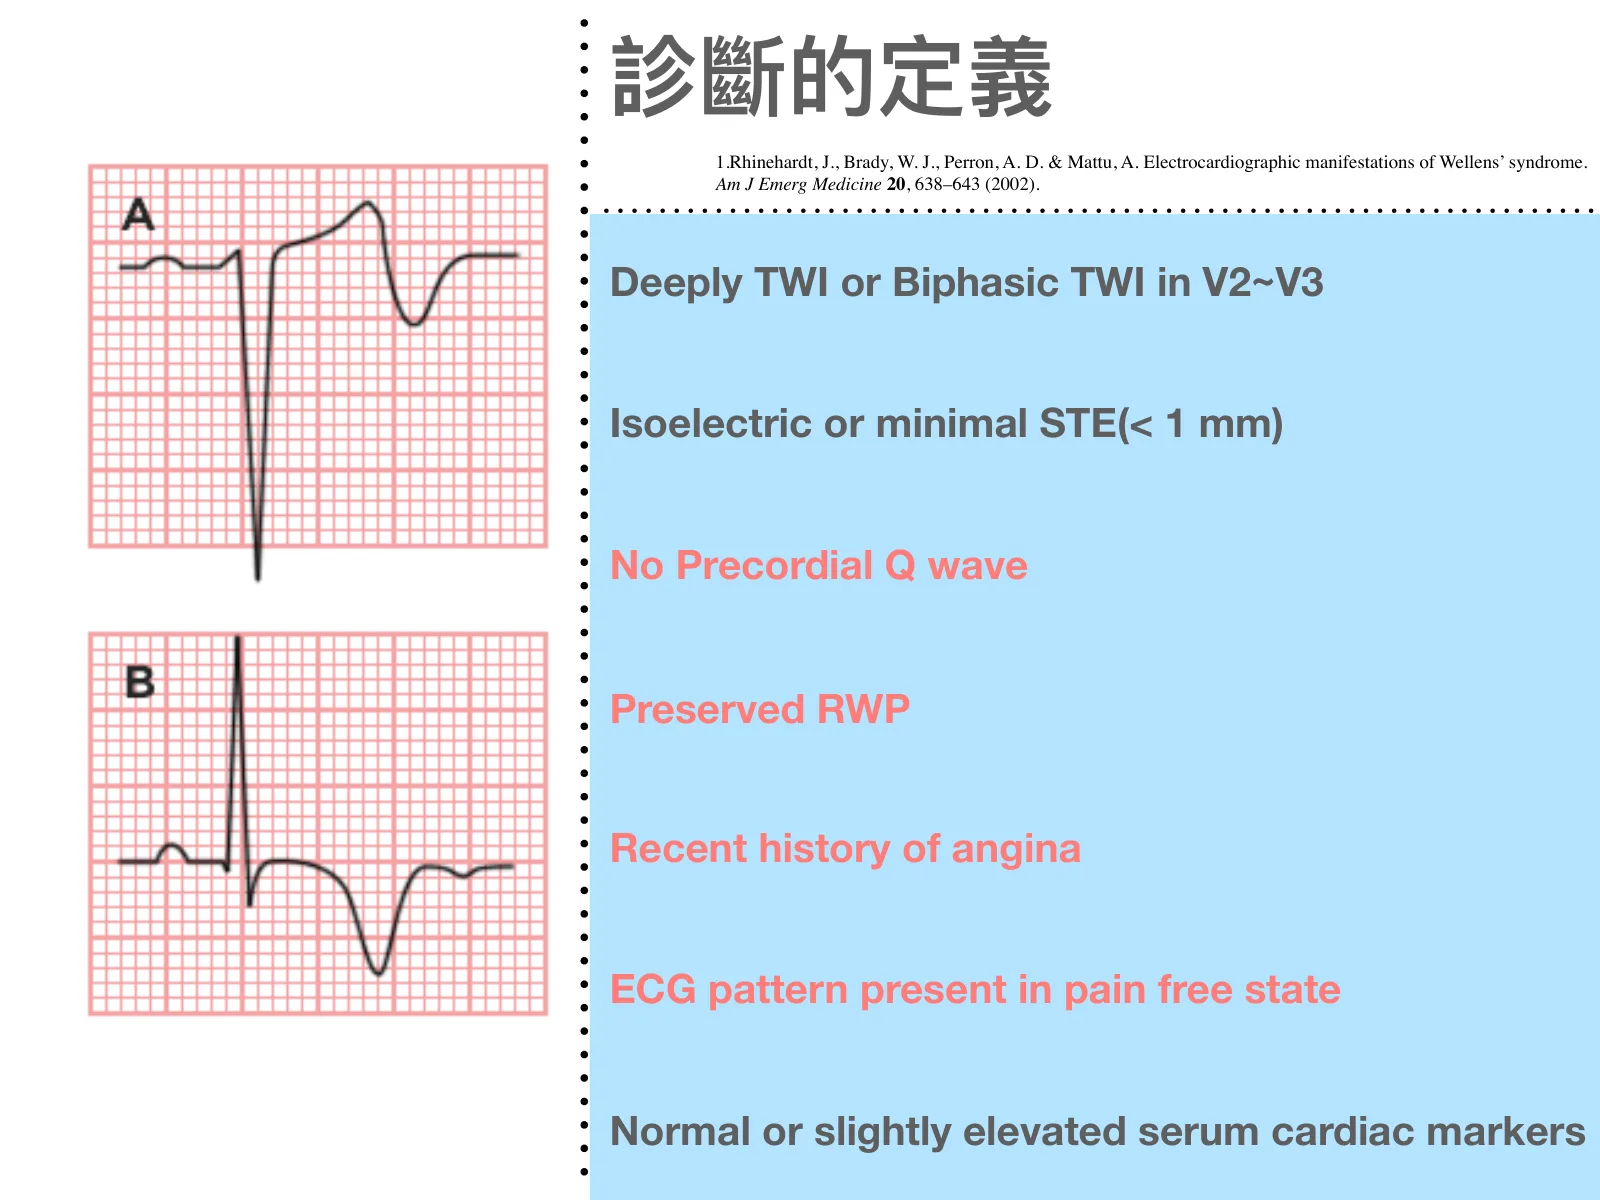
Biphasic or deep symmetric TWI in V2–V4, and the patient is now pain-free ➜ Wellens' syndrome. Don't relax just because there's no pain.

  • Wellens waves ≠ Wellens' syndrome: Wellens waves are just a T-wave shape (biphasic or deep symmetric TWI); Wellens' syndrome is the T-wave shape + the full clinical context. What's the difference? Whether the patient is in pain right now.
  • The mechanism is a reperfusion T wave: the LAD was just occluded and has now opened on its own. That's why the criteria require pain-free, troponin not elevated, no Q wave, and preserved R wave.

Criteria

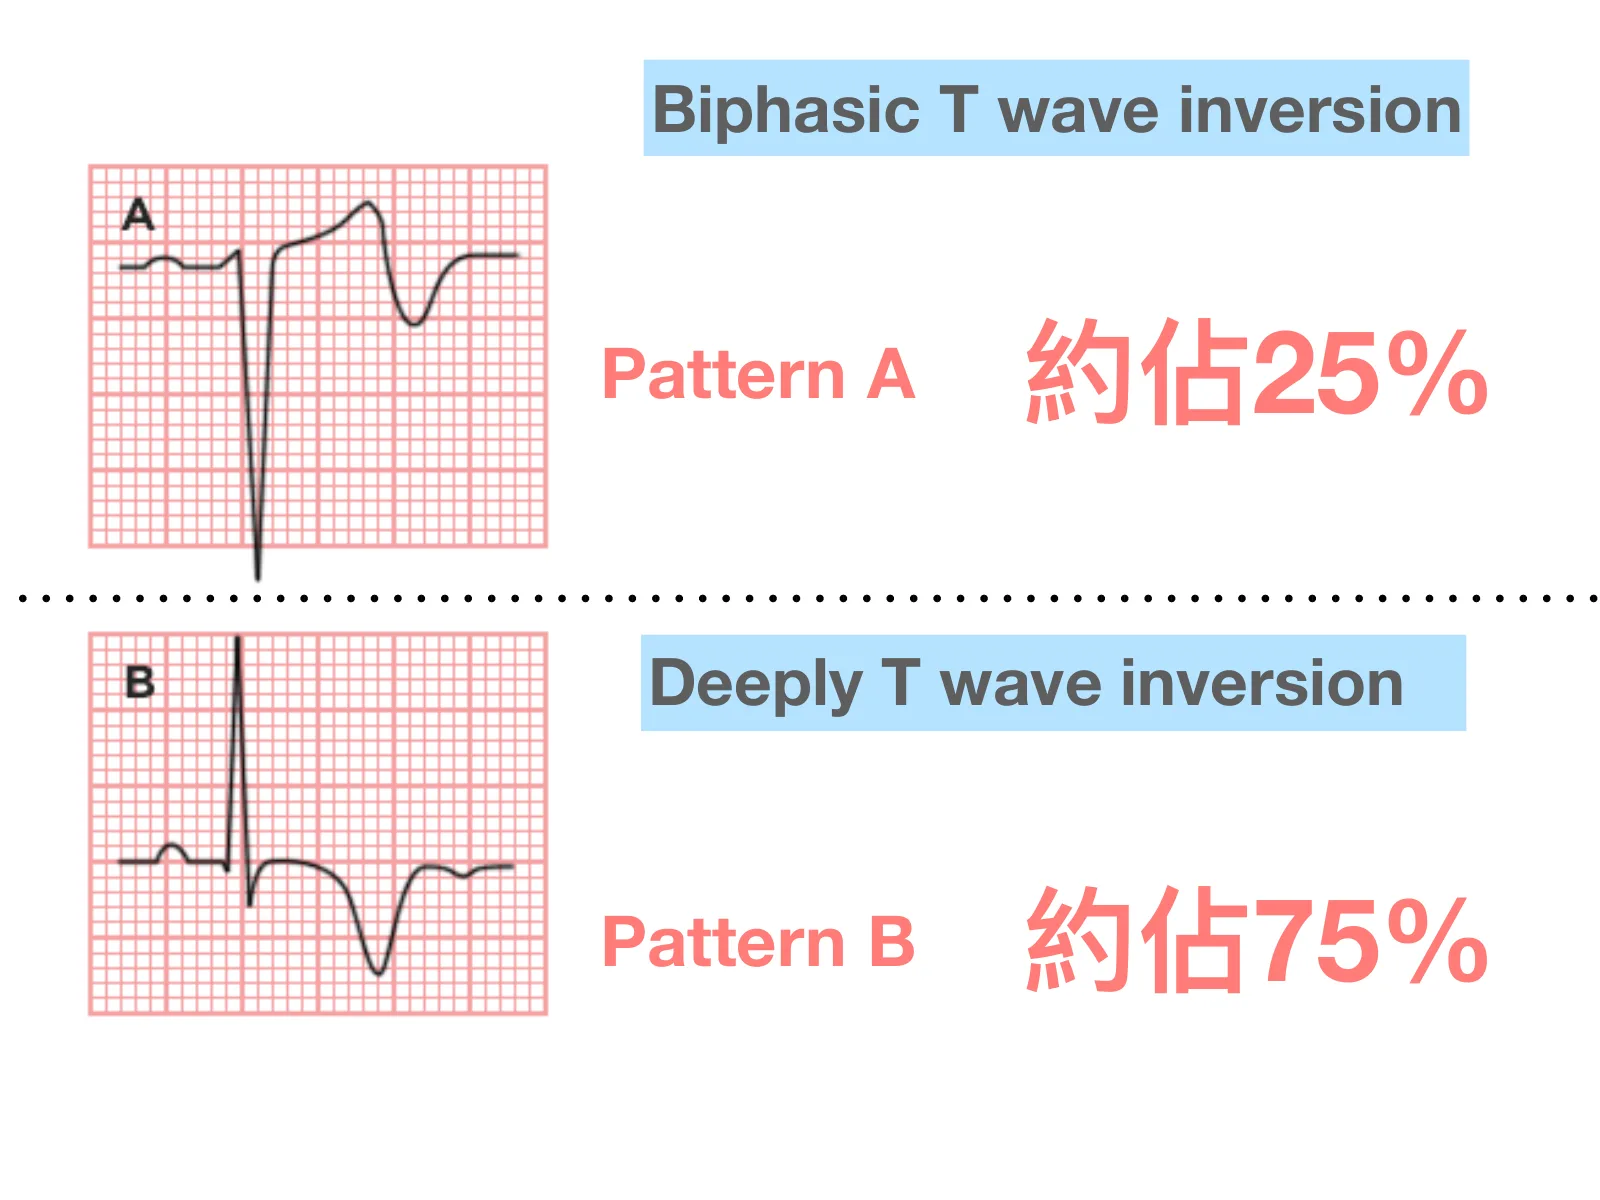
  • The T wave comes in two shapes: deeply and symmetrically inverted, about 75%; biphasic (positive then negative, terminal negativity), about 25% (proportions per the Rhinehardt 2002 review). The literature is inconsistent about which one is Type A and which is Type B; describing the shape directly is least likely to go wrong.
  • ST segment isoelectric or only minimally elevated (Rhinehardt 2002: <1 mm), with no obvious ST elevation.
  • Don't schedule a stress test in Wellens' syndrome: the LAD is already a critical stenosis, and a stress test may precipitate acute MI or sudden death.

Teaching animation

Wellens' syndrome

The chest pain has stopped, but the T wave is still warning you

▶ 1:24 ECG Animations

References
  • Mattu, ECG in Emergency, Acute & Critical Care 2e
  • Sparkson 2e
  • LITFL
Two T-wave diagrams on the left of the slide: the top one labeled A, with the text "Biphasic T wave inversion" and large pink text "Pattern A, about 25%" (in Chinese); the bottom one labeled B, with the text "Deeply T wave inversion" and large pink text "Pattern B, about 75%".
From my 2025 ECG teaching slides for residents at Chi Mei Medical Center (slide 261); proportions per Rhinehardt J, et al. Am J Emerg Med. 2002;20(7):638-643.
Slide titled "Diagnostic definition" (in Chinese): on the left, two T-wave diagrams, A on top (a biphasic waveform, positive then negative) and B below (deep, symmetric inversion); on the right, on a blue background, seven diagnostic criteria: Deeply TWI or Biphasic TWI in V2~V3, Isoelectric or minimal STE(< 1 mm), No Precordial Q wave, Preserved RWP, Recent history of angina, ECG pattern present in pain free state, Normal or slightly elevated serum cardiac markers; the Rhinehardt 2002 citation is at the top.
From my 2025 ECG teaching slides for residents at Chi Mei Medical Center (slide 262); diagnostic criteria from Rhinehardt J, et al. Am J Emerg Med. 2002;20(7):638-643.

Sources

  1. Rhinehardt J, Brady WJ, Perron AD, Mattu A. Electrocardiographic manifestations of Wellens' syndrome. Am J Emerg Med. 2002;20(7):638-643. PMID 12442245.
  2. de Zwaan C, Bär FW, Wellens HJ. Characteristic electrocardiographic pattern indicating a critical stenosis high in left anterior descending coronary artery in patients admitted because of impending myocardial infarction. Am Heart J. 1982;103(4 Pt 2):730-736. PMID 6121481.
  3. de Zwaan C, Bär FW, Janssen JH, et al. Angiographic and clinical characteristics of patients with unstable angina showing an ECG pattern indicating critical narrowing of the proximal LAD coronary artery. Am Heart J. 1989;117(3):657-665. PMID 2784024.
  4. StatPearls: Wellens Syndrome (NCBI Bookshelf, NBK482490)
  5. LITFL: Wellens Syndrome (ECG Library)
  6. LITFL: T wave (ECG Library Basics)
  7. StatPearls: ECG T Wave (NCBI Bookshelf, NBK538264)

Special patterns

De Winter's T wave

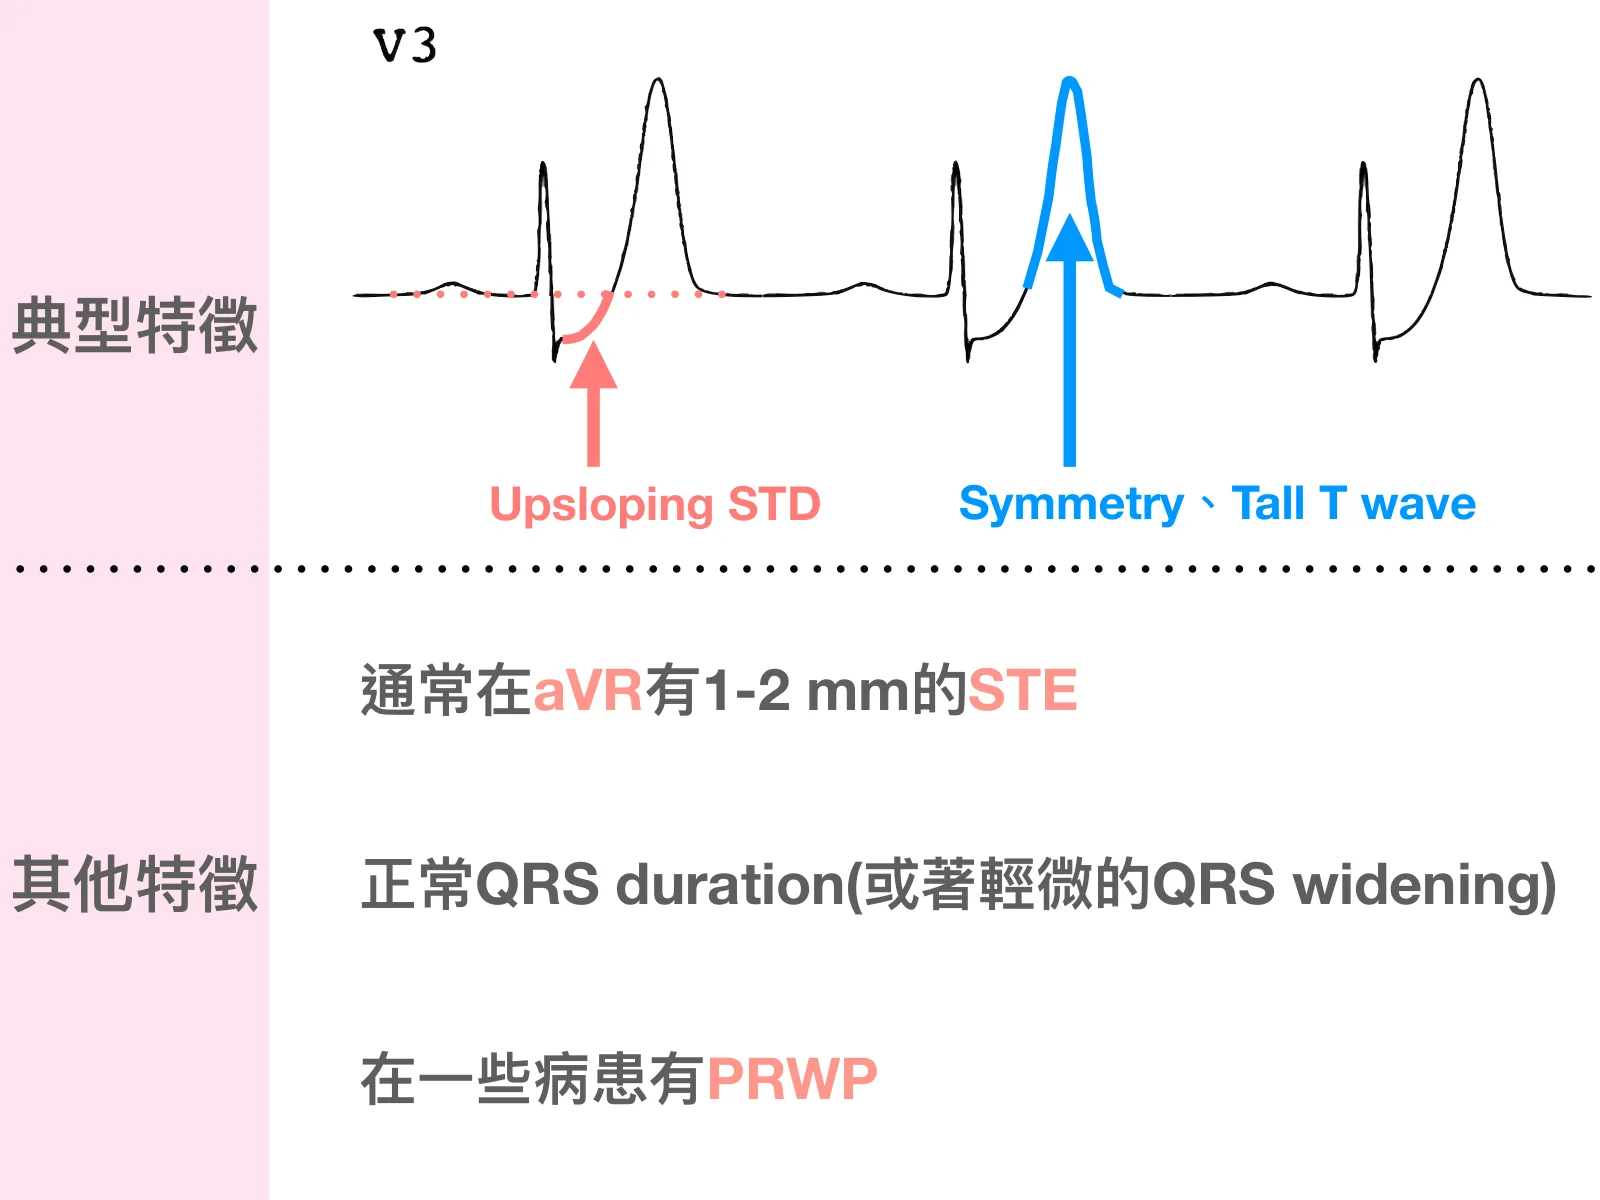
J-point STD + upright, tall, symmetric T wave in V1–V6 ➜ de Winter's T wave. This is the LAD's anterior STEMI equivalent.

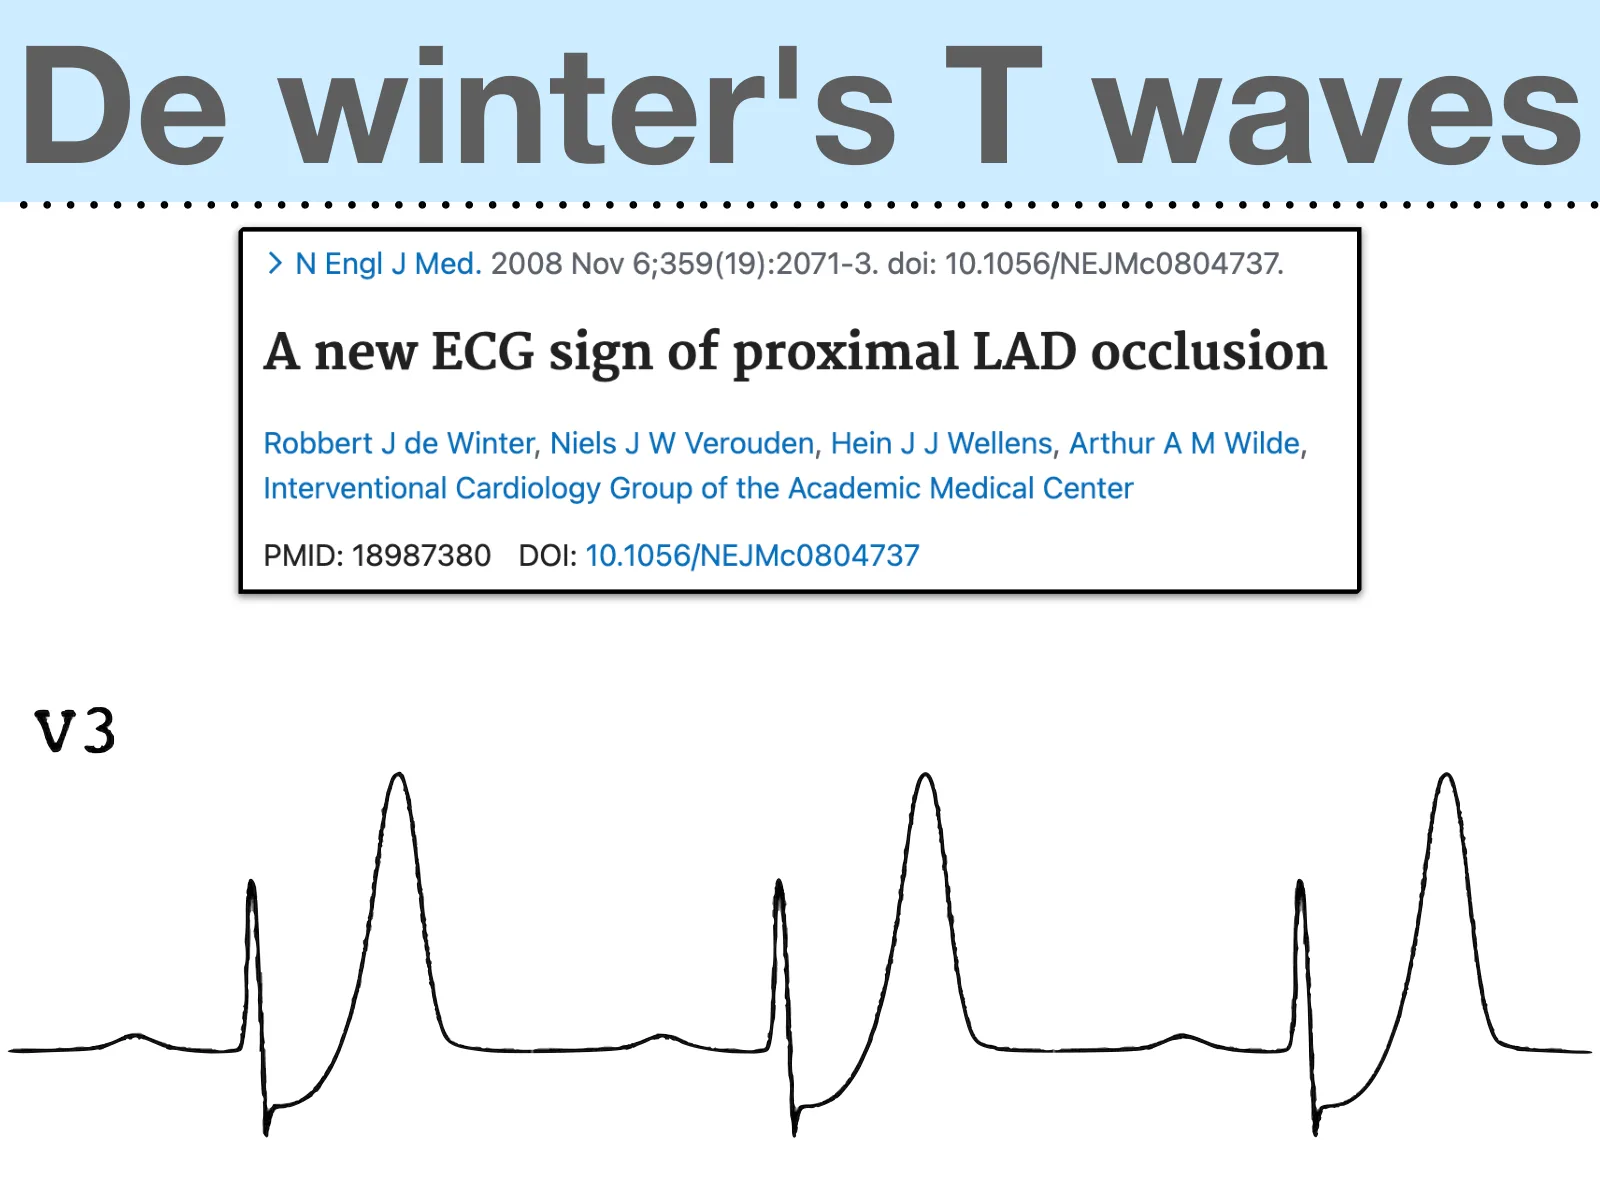
  • de Winter = Mount Fuji, but the foot of the mountain sinks 1-3 mm first: upsloping ST depression at the J point runs straight into a tall, symmetric T wave. This is an acute, ongoing proximal LAD occlusion.
  • de Winter and Wellens both show up in V2-V4, but one is "present progressive" (acute proximal LAD occlusion) and the other is "past perfect" (sub-acute occlusion: occluded before, open now).
  • The 2022 ACC expert consensus has listed de Winter's sign as a STEMI equivalent.

Criteria

  • Upsloping ST depression at the J point in the precordial leads, running straight into tall, symmetrical T waves. The magnitude is written two ways: de Winter's original 2008 letter says 1–3 mm in V1–V6; the same group's Verouden 2009 and ACC 2022 say >1 mm.
  • aVR often shows slight ST elevation. Sources differ on the magnitude: de Winter's original 2008 letter says 1–2 mm in most patients; the same group's larger 2009 cohort, and ACC 2022, both give smaller values.
  • About 2%, with anterior MI as the denominator: de Winter's original 2008 letter found 30 of 1532 anterior MI patients (2.0%); the same group's Verouden 2009 found 35 of 1890 patients undergoing LAD primary PCI for anterior MI (2%). The two cohorts overlap; these are not two independent studies replicating each other.
Slide titled "De winter's T waves": in the middle, a black-framed screenshot of the PubMed citation page, showing "N Engl J Med. 2008 Nov 6;359(19):2071-3. doi: 10.1056/NEJMc0804737.", the title "A new ECG sign of proximal LAD occlusion", the authors "Robbert J de Winter, Niels J W Verouden, Hein J J Wellens, Arthur A M Wilde, Interventional Cardiology Group of the Academic Medical Center", and "PMID: 18987380 DOI: 10.1056/NEJMc0804737"; below, a line drawing of lead V3 with three beats: after the QRS it dips first, then slopes up into a tall, symmetric T wave.
From my 2025 ECG teaching slides for residents at Chi Mei Medical Center (slide 274); top: screenshot of the PubMed citation page: de Winter RJ, Verouden NJ, Wellens HJ, Wilde AA. N Engl J Med. 2008;359(19):2071-2073 (PMID 18987380)
Left column of the slide on a pink background, labeled "Typical features" at the top and "Other features" below (in Chinese). Top right, a line drawing of lead V3 with three beats: a red arrow on the first beat marks "Upsloping STD", a blue arrow on the second beat's T wave marks "Symmetry, Tall T wave". Text in the lower half (in Chinese): "Usually 1-2 mm STE in aVR", "Normal QRS duration (or slight QRS widening)", "PRWP in some patients".
From my 2025 ECG teaching slides for residents at Chi Mei Medical Center (slide 276); features summarized from de Winter RJ, et al. N Engl J Med. 2008;359(19):2071-2073. aVR 1–2 mm is how this original letter puts it; the same group's larger 2009 cohort and ACC 2022 give smaller values.

Sources

  1. de Winter RJ, Verouden NJ, Wellens HJ, Wilde AA; Interventional Cardiology Group of the Academic Medical Center. A new ECG sign of proximal LAD occlusion. N Engl J Med. 2008;359(19):2071-2073. PMID 18987380. (Letter; no abstract on PubMed)
  2. Verouden NJ, Koch KT, Peters RJ, et al. Persistent precordial "hyperacute" T-waves signify proximal left anterior descending artery occlusion. Heart. 2009;95(20):1701-1706. PMID 19620137.
  3. LITFL: De Winter T Wave
  4. Writing Committee (Kontos MC, de Lemos JA, Deitelzweig SB, et al). 2022 ACC Expert Consensus Decision Pathway on the Evaluation and Disposition of Acute Chest Pain in the Emergency Department. J Am Coll Cardiol. 2022;80(20):1925-1960. PMID 36241466.
  5. Dr. Smith's ECG Blog: Hyperacute T waves
  6. Ken Grauer, ECG Blog #319 — QRS Alternans?

Special patterns

South African Flag sign

STE in all three leads I, aVL, and V2 (the STE in V2 that "skips V1 and isn't contiguous" is the soul of it), reciprocal STD in lead III (often extending to II, aVF) ➜ South African Flag sign.

  • STE in leads I, aVL, V2 + reciprocal STD in lead III (II and aVF often go along, but III is the most obvious). On paper, aVL and V2 sit in two different zones, so under the traditional grouping they aren't contiguous.
  • Ken Grauer's added third criterion: no STE in any chest lead other than V2. This is the key to distinguishing it from an LAD occlusion that's still evolving, where the STE hasn't yet spread to chest leads beyond V2.
  • Why it's easy to miss: aVL and V2 aren't contiguous in the traditional grouping, so the pattern a 1st or 2nd diagonal occlusion produces, "aVL + V2 STE, nothing in the other chest leads," may by definition fail to meet the two-contiguous-leads STEMI criteria.

Criteria

  • STE in leads I, aVL, V2 + reciprocal STD in lead III (often extending to II, aVF, to a lesser degree); Ken Grauer adds one more: no STE in any chest lead other than V2.

Sources

  1. Ken Grauer. ECG Blog #540 — Does it "Fit" the Clinical? (2026-08-01)
  2. LITFL: High Lateral STEMI (Mike Cadogan, Robert Buttner)
  3. Durant E, Singh A. Acute first diagonal artery occlusion: a characteristic pattern of ST elevation in noncontiguous leads. Am J Emerg Med. 2015 Sep;33(9):1326.e3-5. PMID 25722286
  4. Littmann L. South African flag sign: a teaching tool for easier ECG recognition of high lateral infarct. Am J Emerg Med. 2016 Jan;34(1):107-9. PMID 26527178
  5. Dr. Smith's ECG Blog: A woman in her 30s with sudden chest pain, nausea, and diaphoresis. Was her cardiology management appropriate? (2022-04-08, My Comment by Ken Grauer)
  6. Dr. Smith's ECG Blog: Acute OMI or "Benign" Early Repolarization? (2023-12-27, My Comment by Ken Grauer)

Special patterns

Aslanger's pattern

STE only in lead III (not II/aVF) + STD in V4–V6, but no STD in V2 ➜ Aslanger's pattern. An inferior OMI layered on multivessel disease.

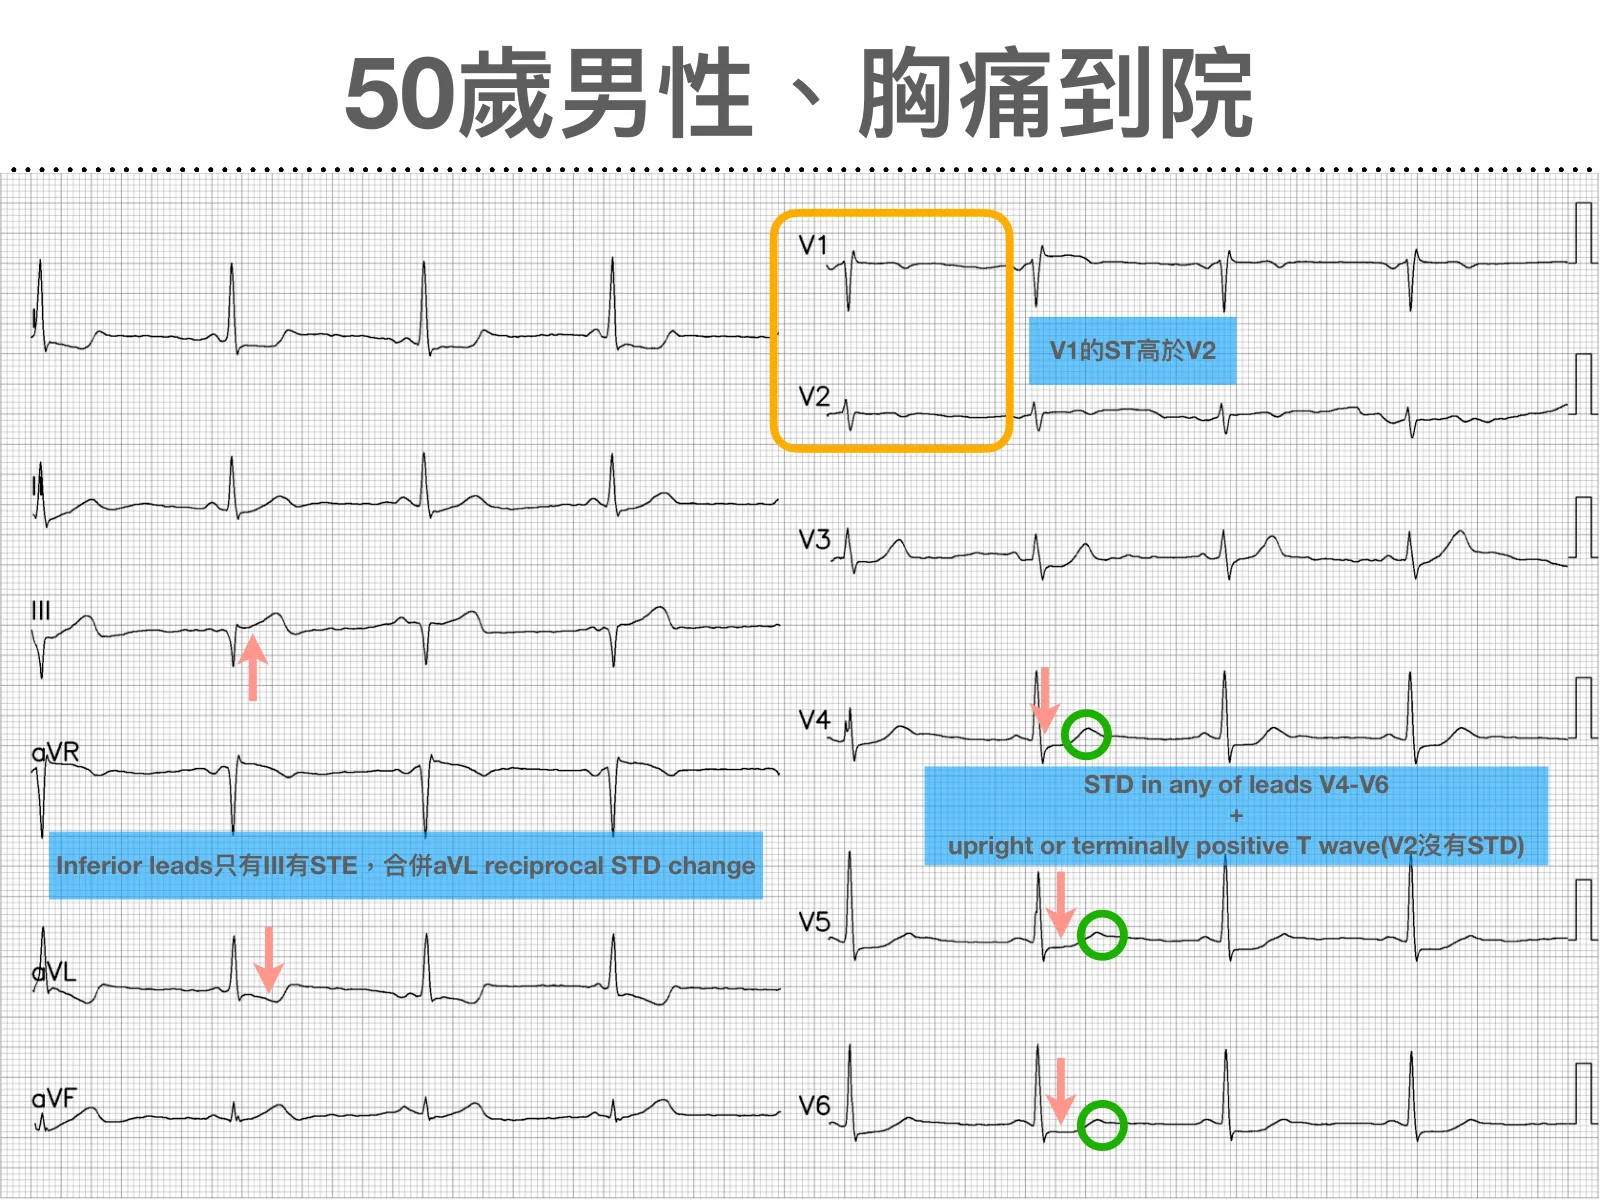
  • Three criteria (Aslanger 2020 original paper): ① STE in lead III but not in the other inferior leads (II, aVF) ② STD in any of V4–V6 with a positive or terminally positive T wave, and no STD in V2 ③ ST in lead V1 higher than in V2. The mechanism: the ST vector of the inferior MI plus the ST vector of subendocardial ischemia from multivessel disease add up and point rightward; II and aVF get canceled out, leaving STE visible only in lead III ("two fans blowing at each other, and II and aVF in the middle get canceled out").
  • Ken Grauer's add-on: the only leads with obvious STE may be just III, aVR, V1; reciprocal STD in lead I may be more obvious than in aVL (because the ST vector points rightward).
  • The two incidence figures have different denominators; don't mix them up: 6.3% of the NSTEMI population; the paper also says 13.3% of inferior MIs may present with this pattern. In-hospital and one-year mortality in this group are similar to inferior STEMI (no statistically significant difference), yet they may miss out on emergent revascularization because they get labeled NSTEMI: that's the real clinical significance of Aslanger's pattern.

Criteria

  • ① Any STE in lead III but not in the other inferior leads; ② STD in any of V4–V6 (but not V2), with a positive or terminally positive T wave; ③ ST in lead V1 higher than in V2.
  • Incidence: 6.3% in the NSTEMI population, 0.5% in the no-MI control group; the paper estimates 13.3% of inferior MIs may present with this pattern. Mortality: in-hospital and one-year mortality similar to inferior STEMI, with no statistically significant difference.
12-lead ECG titled "50-year-old man, presenting with chest pain" (in Chinese). Left half, I/II/III/aVR/aVL/aVF: a red up arrow in lead III marks STE, a red down arrow in aVL marks reciprocal STD; blue-background text: "Among the inferior leads only III has STE, with reciprocal STD change in aVL". Right half, V1–V6: an orange box around V1/V2, blue-background text: "ST in V1 higher than V2"; V4/V5/V6 each have a red down arrow and a green open circle, blue-background text: "STD in any of leads V4-V6 + upright or terminally positive T wave (no STD in V2)"
From my 2025 ECG teaching slides for residents at Chi Mei Medical Center (slide 294). ECG source: a case shared by Emre Aslanger (@AslangerE) on X (Twitter) on 2022-05-07; the arrows, boxes, and Chinese annotations on the image are mine.

Sources

  1. Aslanger E, Yıldırımtürk Ö, Şimşek B, Sungur A, Türer Cabbar A, Bozbeyoğlu E, Karabay CY, Smith SW, Değertekin M. A new electrocardiographic pattern indicating inferior myocardial infarction. J Electrocardiol. 2020 Jul-Aug;61:41-46. PMID 32526537
  2. Miyauchi E, Kuwazuru K, Arikawa R, Tokutake D, Chaen H, Oketani N, Ohishi M. Clinical Features of the Aslanger Pattern to Compensate for the Limitation of ST-Elevation Myocardial Infarction (STEMI) Criteria. Cureus. 2023 Jan;15(1):e33227. PMID 36601361
  3. LITFL: Aslanger Pattern: Another OMI? (Robert Buttner, Mike Cadogan)
  4. Ken Grauer. ECG Blog #529 — Should Prompt Cath be Done? (2026-05-02)
  5. Dr. Smith's ECG Blog: Typical Chest Pain: Would you activate the cath lab? Would you advocate if the interventionalist was not interested? (2021-05-10)

Special patterns

Northern OMI

⭐️ New in 2025

So far there's only one single-center, retrospective study on this pattern; for criteria and level of evidence, go straight to Part 3 (B). I'm not giving my own definition here, so you don't end up memorizing the wrong thing.

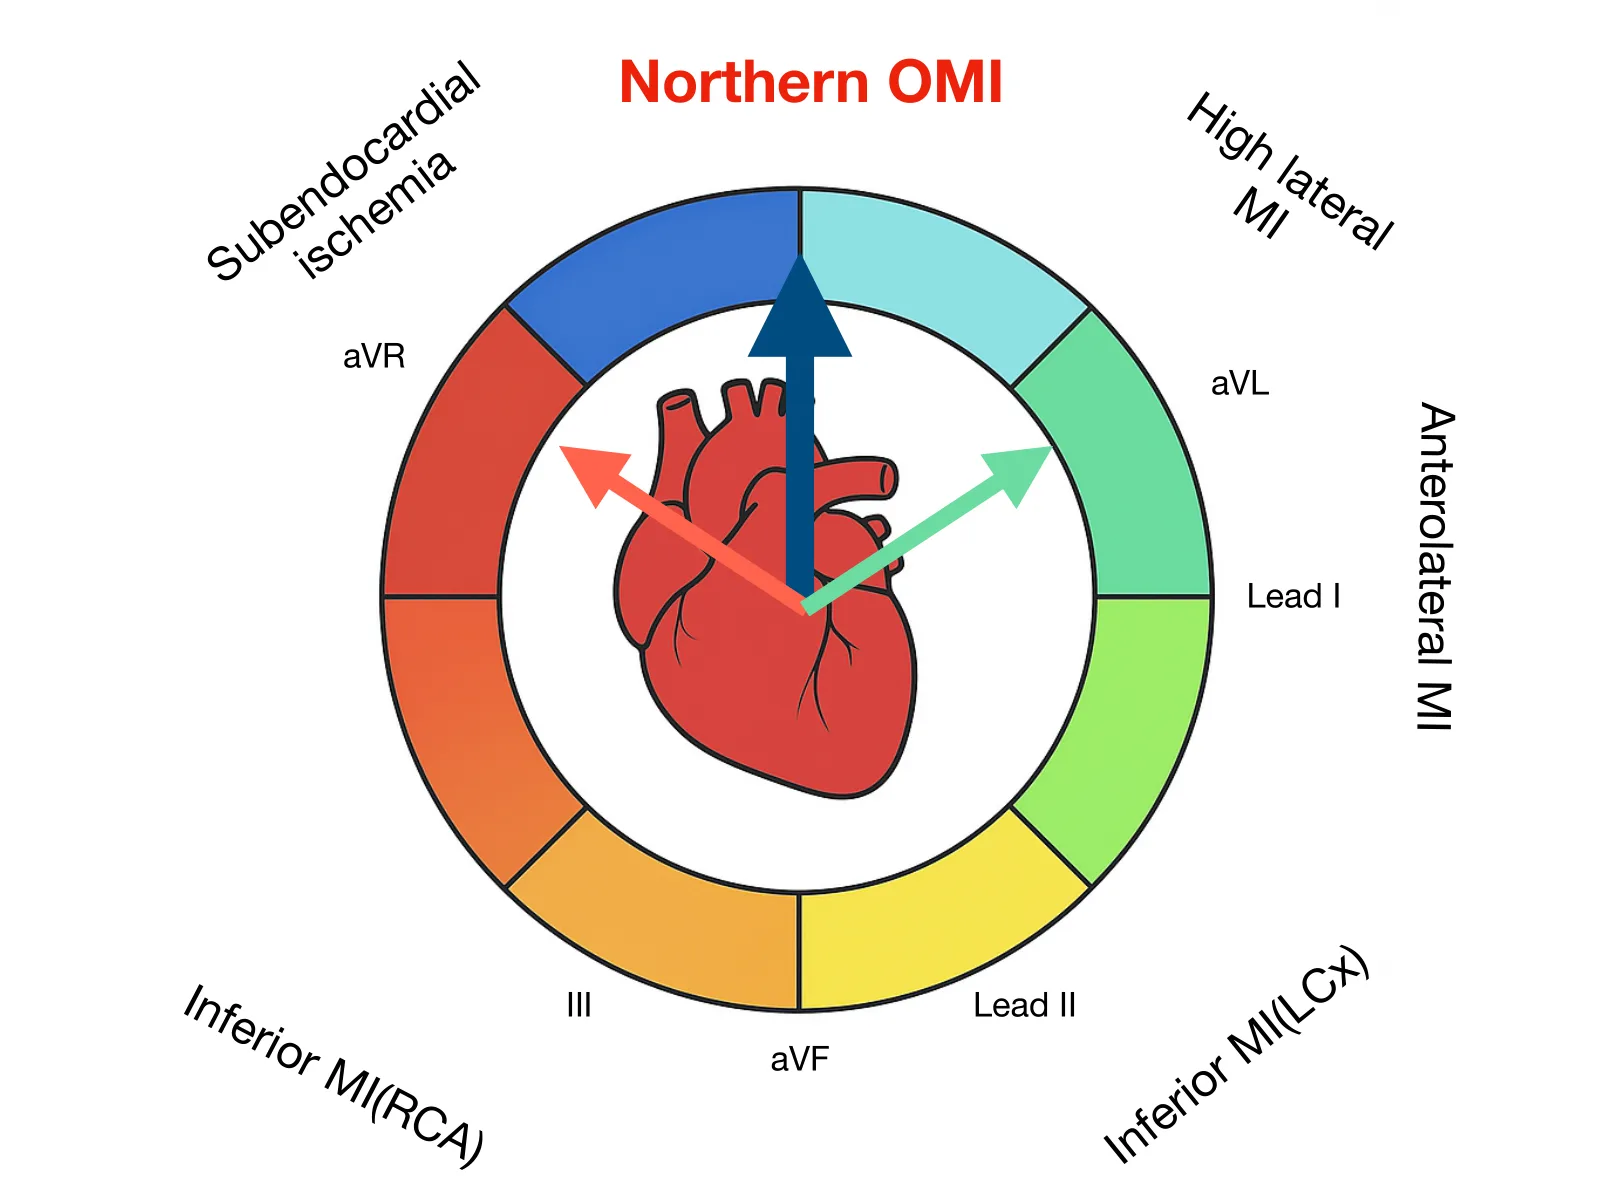
  • Northern OMI means the ST vector points straight up (north): STE in aVR and aVL together, with reciprocal STD inferiorly. Dr. Smith's ECG Blog puts it this way: it's a STEMI pattern associated with subepicardial (transmural) ischemia of the heart's base (the very top of the heart, just below the atria, possibly especially the base of the septum). In the same post, Amandeep Singh, who contributed the case, wrote that it may come from left main occlusion, proximal LAD occlusion, or multivessel coronary artery disease.
  • ⚠️ The evidence is thin, and we have to be honest about it: Dr. Smith's ECG Blog itself calls it "a vaguely defined pattern." The only original study we found is Ni 2026, a small retrospective case analysis (the authors are all from the same hospital), and the authors also say the patients they enrolled did not fully meet the current Northern OMI diagnostic criteria, which is why they propose a modified version. Sources differ: Dr. Smith's ECG Blog (2025-12-18) lists aVR, aVL STE (often with negative T-waves) + inferior (II, III, aVF) and lateral (V4–V6) STD (T wave positive or biphasic); Ni 2026's modified version only says aVR, aVL STE + reciprocal STD in at least II, III, aVF. Recognize it, but don't rely on it.
  • Not the same as aVR STE + multiple leads STD: when Smith compiled cases of complete left main occlusion in 2019 (which he himself called anecdotal cases), the Northern OMI pattern was among them, and he states plainly, "LM occlusion does not present with isolated STE in aVR." So when you see STE in aVR, the first thing to do is look at aVL: if aVL is elevated too and there's inferior reciprocal STD, think Northern OMI.

Criteria

  • Ni 2026's proposed modified criteria: STE in aVR and aVL, with reciprocal STD in at least II, III, aVF (the criteria listed in the abstract don't mention T-wave direction and don't require V4–V6). This is a proposal from a small retrospective case analysis, not a validated standard.
Slide titled "Northern OMI": a colored ring divided into eight segments, with leads (aVR, aVL, Lead I, Lead II, aVF, III) and corresponding regions (Subendocardial ischemia, High lateral MI, Anterolateral MI, Inferior MI(LCx), Inferior MI(RCA)) labeled around the outside; in the center of the ring is a cartoon heart, with three arrows starting from the center: red pointing to aVR, green pointing to aVL, dark blue pointing straight up.
From my 2025 ECG teaching slides for residents at Chi Mei Medical Center (slide 324): the ST vector points straight up (north).

Sources

  1. Ni H, Wan X, Shi T, Gao Z, Pan H. A new and modified northern occlusion myocardial infarction pattern. J Electrocardiol. 2026 Mar-Apr;95:154212. PMID 41719915
  2. Dr. Smith's ECG Blog: What is this pattern? (2025-12-18, case contributed by Amandeep Singh, Highland Hospital)
  3. Dr. Smith's ECG Blog: How does Acute Total Left Main Coronary occlusion present on the ECG? (2019-08-09)

Special patterns

N wave sign

⭐️ New in 2025

In II/III/aVF or I/aVL, a terminal QRS notch/deflection and a wider QRS in that lead ➜ N wave sign. Full criteria in Part 3 (B).

  • N wave sign = an extra notch or deflection at the end of the QRS. The original Niu 2013 study defines it with four criteria: ① a notch/deflection at the terminal QRS ② a height cutoff of 2 mm (referenced to the PR segment) ③ continuous change of the notch within 24 hours (even disappearing or turning into an S wave) ④ prolonged QRS duration in these leads. The mechanism is a delayed activation wave from the left ventricular basal region (LCx territory): "the whole class hands in their exams together, but one student writes too slowly and hands it in last."
  • To tell it apart from a benign J wave (early repolarization), don't just look at which lead it's in: lead location can only tell you "if it is an N wave, where the culprit might be," not "whether it is an N wave." Look at what the criteria themselves require: ① height (benign ones often aren't this big) ② dynamics (an N wave changes within 24 hours; benign early repol is static, the old ECGs looked like this too) ③ whether the QRS is widened (an N wave is delayed activation and drags out the QRS); then add the clinical context (ACS symptoms or not) and comparison with old ECGs.
  • Picking up the LCx: N wave in II, III, aVF, sensitivity 77%, specificity 89%. ⚠️ The target condition for these numbers is whether the culprit is the LCx, in patients with confirmed NSTEMI who underwent coronary angiography, not "picking out OMI among chest pain patients," so they can't be lined up side by side with the numbers for the earlier findings. A study from another group (Rostoff 2020) came out more conservative: among patients with an LCx/OM culprit, the most common finding was T-wave precordial instability, not the N wave; an N wave in aVL was an independent predictor of an LCx/OM culprit, but patients with an LAD/diagonal culprit also showed inferior N waves. The N wave is a clue pointing to the LCx, not a high-sensitivity screening tool.

Criteria

  • The N wave definition in the original Niu 2013 study: ① a notch or deflection at the terminal QRS; ② notch/deflection height cutoff of 2 mm (referenced to the PR segment; the original says ≥2 mm, the independent source Alsagaff 2022 says >2 mm); ③ continuous change of the notch within 24 hours, even disappearing or turning into an S wave; ④ prolonged QRS duration in these leads.
  • N wave in II, III, aVF: sensitivity 77%, specificity 89% for identifying an LCx culprit (population: NSTEMI patients who underwent coronary angiography; the target condition is "is the culprit the LCx," not "is there an OMI").
  • NSTEMI with an N wave (N-NSTEMI): among patients with an LCx culprit, the incidence of all MACE, all-cause death, stent thrombosis, TVR, and recurrent unstable angina was similar to STEMI and higher than in NSTEMI without an N wave; the authors conclude that N-NSTEMI carries a risk equivalent to acute STEMI.

Sources

  1. Niu T, Fu P, Jia C, Dong Y, Liang C, Cao Q, Yang Z, Fu R, Zhang X, Sun Z. The delayed activation wave in non-ST-elevation myocardial infarction. Int J Cardiol. 2013 Jan 10;162(2):107-11. PMID 21663984
  2. Alsagaff MY, Wardhani LFK, Pratanu I, Kartikasari DP, Doevendans PA. NSTEMI with total left circumflex occlusion: how the N-wave might help (case report). Oxf Med Case Reports. 2022 Feb;2022(2):omac010. PMID 35198230
  3. Yang T, Chen J, Liu X, Xu C, Niu T, Fu X, Fu P. Non-ST-elevated myocardial infarction with "N" wave on electrocardiogram and culprit vessel in left circumflex has a risk equivalent to ST-elevated myocardial infarction. Clin Cardiol. 2020 May;43(5):491-499. PMID 32032438
  4. Rostoff P, Wisniewski P, Gajos G, Konduracka E, Nessler J, Kruszelnicka O. Electrocardiographic identification of the culprit coronary artery in acute non-ST-elevation myocardial infarction: predictive value of N-wave and T-wave precordial instability. Coron Artery Dis. 2020 Nov;31(7):590-596. PMID 32568742

Special calculations

Ant.STE (QS pattern present): suspect LV aneurysm with STEMI

T/QRS ratio

STE, with well-formed Q waves / QS waves sitting in front of it in V1–V4 ➜ T/QRS ratio. If the single-lead and sum methods disagree ➜ ED echo.

  • Prerequisite: well-formed Q waves, or at least one QS wave, sitting in front of the STE in V1–V4. First confirm you're in LVA (LV aneurysm) morphology territory, then use this rule to sort "old scar" from "burning right now." For the exact definition of a QS wave, see Smith's original blog post. This rule can't be used to separate out early repol; that's the 4-variable formula's job, and plugging into the wrong socket gives the wrong answer.
  • Mnemonic: the T wave is the fire, the QRS is the wall. In acute MI the T wave is large relative to the QRS; in old MI/LV aneurysm the T wave is small: see whether the fire has burned over the top of the wall.
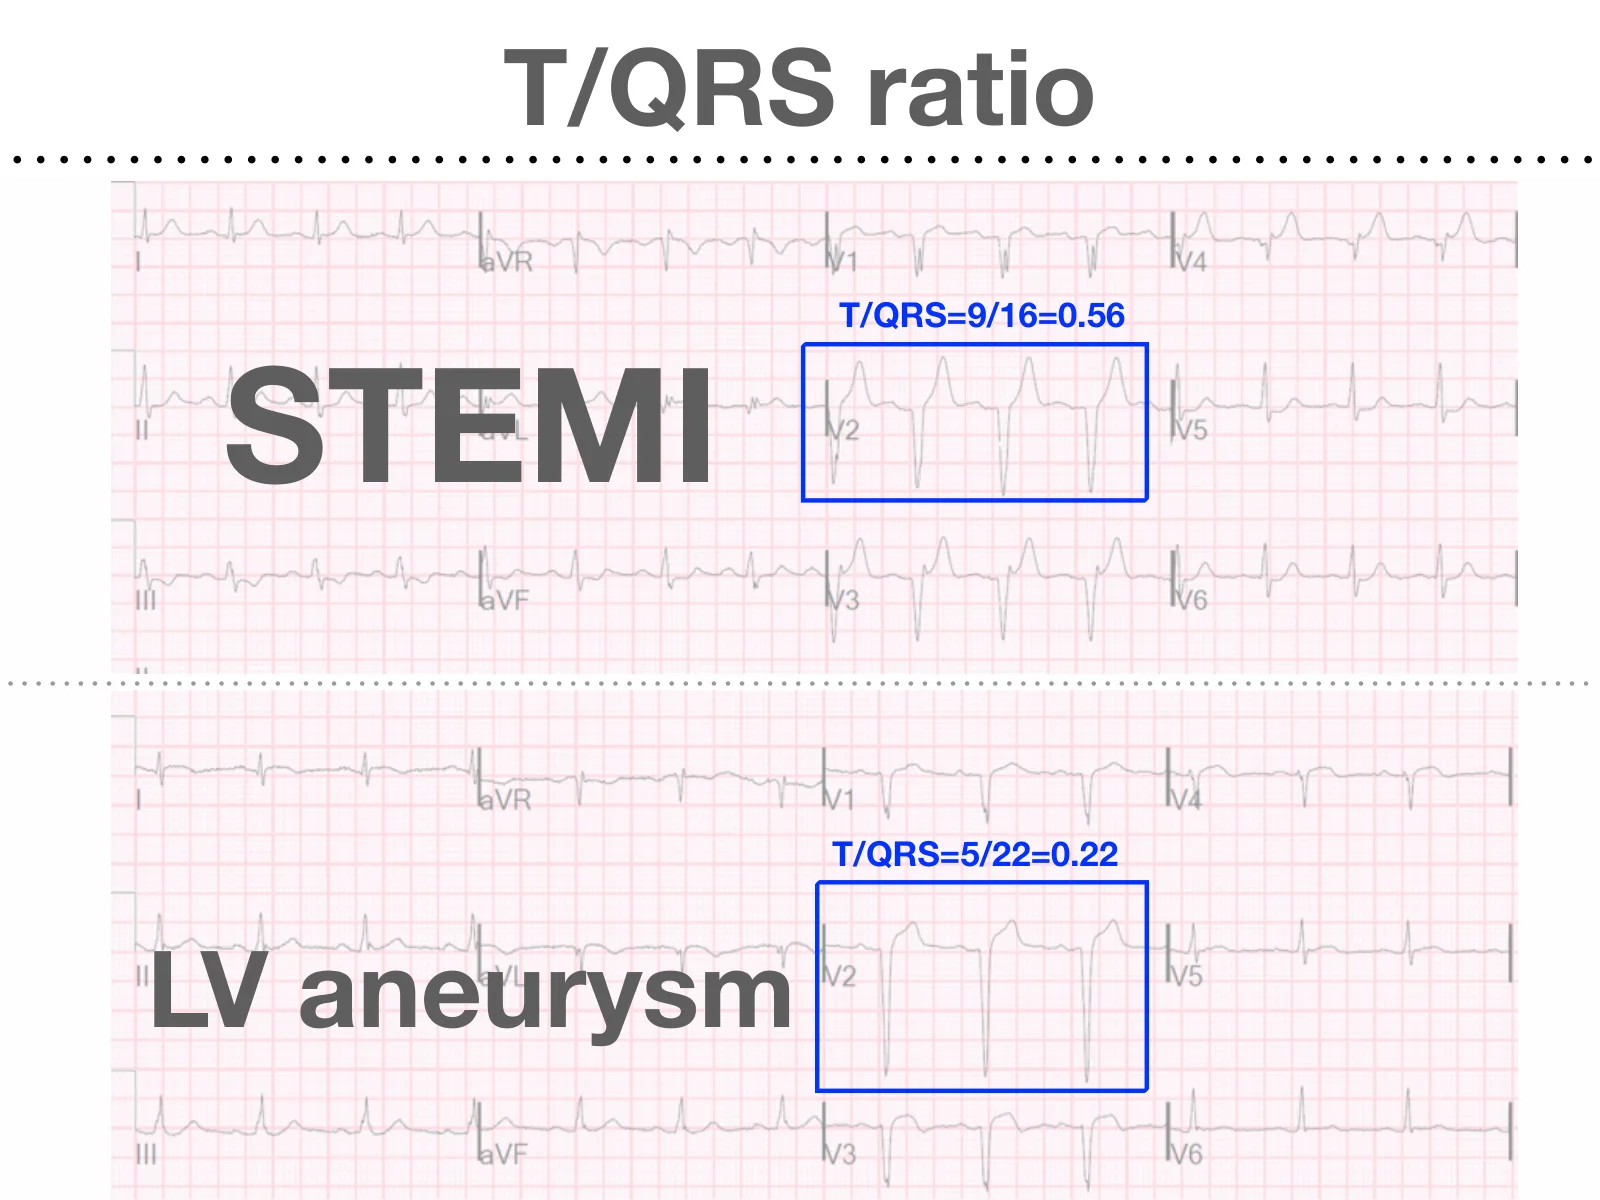
  • How to calculate: measure T-wave amplitude and QRS amplitude in each of V1–V4. Compute T÷QRS once for each lead and take the largest; then sum the four T's and the four QRS's and divide, for one sum ratio. Each ratio goes with its own cutoff; don't mix them.

Criteria

  • Single-lead ratio: T/QRS ratio ≥0.36 in any lead V1–V4 ➜ favors acute anterior STEMI; all of V1–V4 <0.36 ➜ favors LV aneurysm. (Klein 2015 writes ≥0.36, LITFL writes >0.36; the only difference is the point exactly at 0.36.)
  • Sum ratio: (sum of T-wave amplitudes in V1–V4) ÷ (sum of QRS amplitudes in V1–V4) >0.22 ➜ favors acute anterior STEMI. 0.22 goes only with the sum ratio; don't apply it to a single lead.
Slide titled "T/QRS ratio": top row, a 12-lead ECG labeled STEMI, with V2 boxed in blue and marked T/QRS=9/16=0.56; bottom row, a 12-lead ECG labeled LV aneurysm, with V2 boxed in blue and marked T/QRS=5/22=0.22; the two ECGs are compared top and bottom
From my 2025 ECG teaching slides for residents at Chi Mei Medical Center (slide 93): example single-lead T/QRS measurements in V2 for STEMI vs LV aneurysm (0.56 vs. 0.22)

Sources

  1. Smith SW. T/QRS ratio best distinguishes ventricular aneurysm from anterior myocardial infarction. Am J Emerg Med. 2005 May;23(3):279-87. PMID 15915398
  2. Klein LR, Shroff GR, Beeman W, Smith SW. Electrocardiographic criteria to differentiate acute anterior ST-elevation myocardial infarction from left ventricular aneurysm. Am J Emerg Med. 2015 Jun;33(6):786-90. PMID 25862248
  3. LITFL ECG Library: Left Ventricular Aneurysm
  4. Dr. Smith's ECG Blog: Chest Pain, "Negative" Stress Tests, POCUS, & ECG Equations - A Case from Salim Rezaie (R.E.B.E.L. EM)

Special calculations

Subtle STE over ant.leads: apply the 4 variable formula

4-variable formula

STE, no Q waves, and V2–V4 looks like early repol ➜ check for TQRSD first; no TQRSD and you've also passed the other gates ➜ 4-variable formula. Remember: the formula can only push suspicion up.

  • Prerequisites (you must pass the gate first; if you don't, don't calculate): ≥1 mm STE in at least one lead of V2–V4, and none of the following: LVH, Q waves/QS in V2–V4, inferior or precordial STD, TQRSD, precordial TWI, straight or convex ST, STE >5 mm. Failing the gate sends you different places: TQRSD or STD ➜ already obvious OMI, Call CV directly; Q waves/QS ➜ switch to T/QRS ratio; LVH ➜ don't calculate, look at the baseline ECG and get an echo; precordial TWI ➜ think Wellens; straight/convex ST or STE >5 mm ➜ already beyond subtle, no need to calculate.
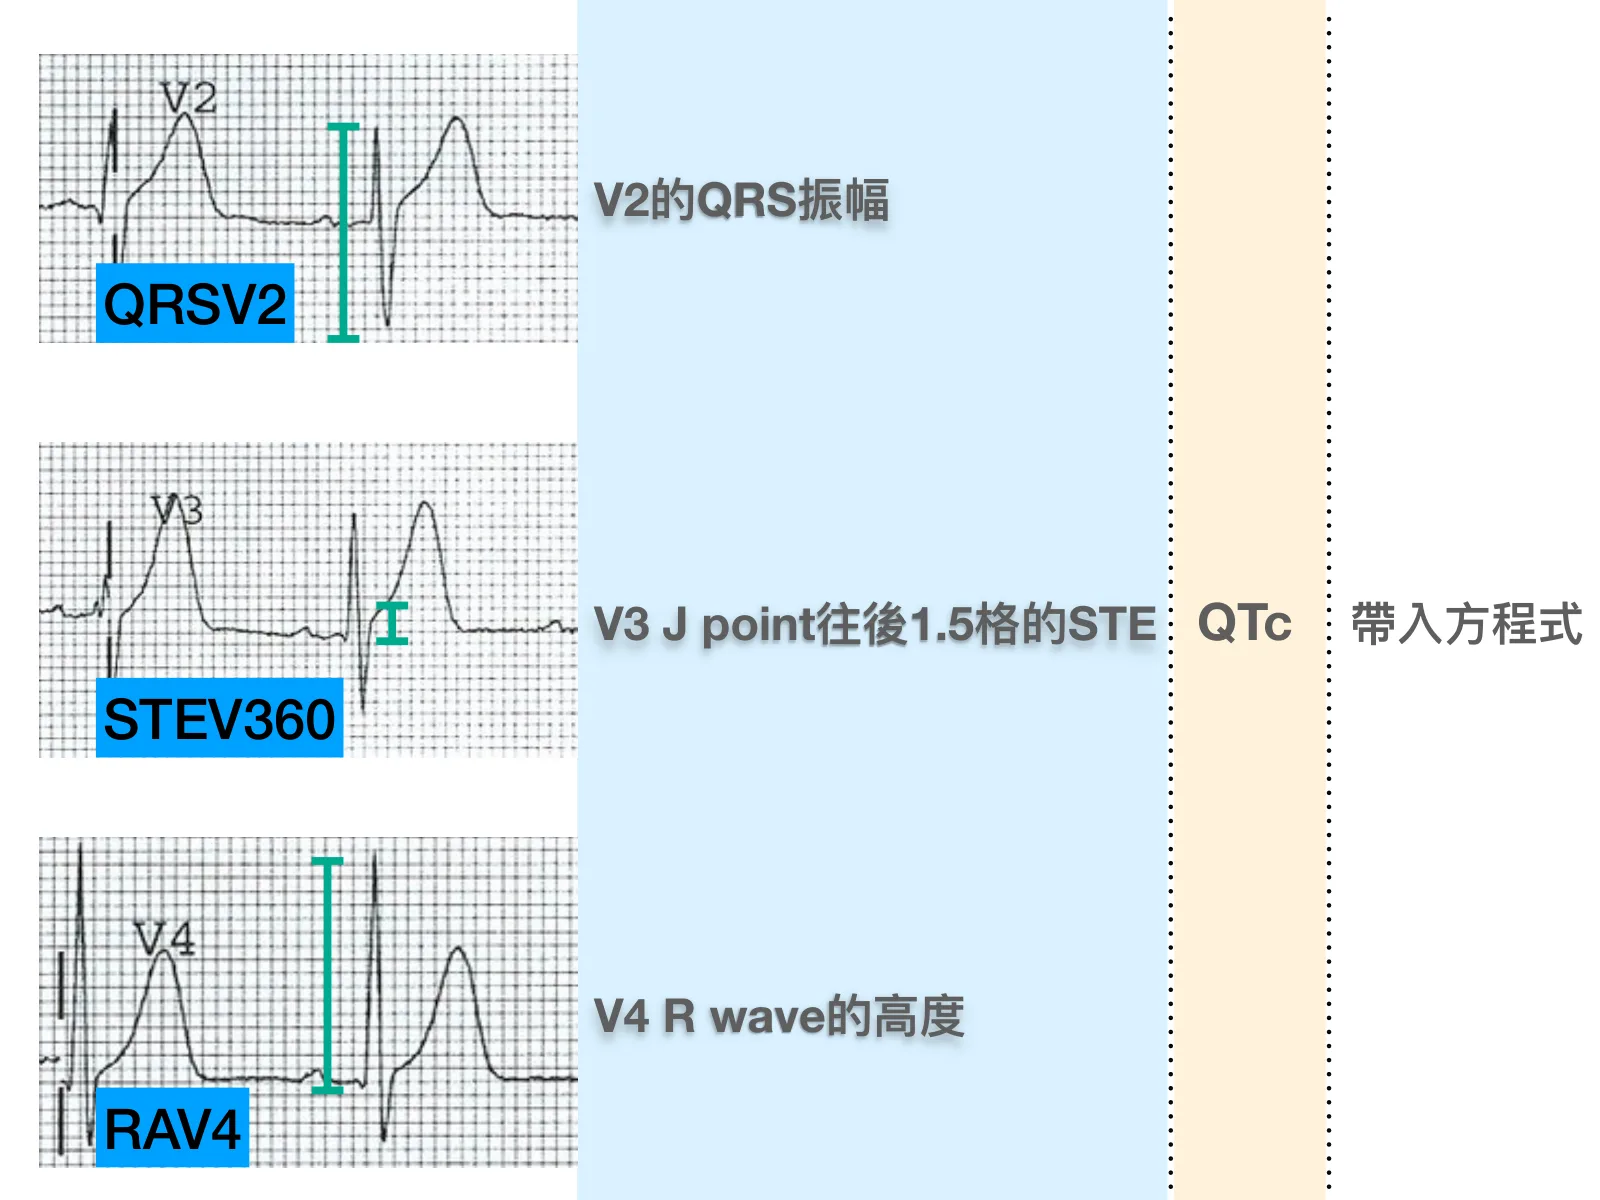
  • How the two formulas relate: the 3-variable formula (Smith 2012) uses three variables, STE60V3, QTc, and RAV4; the 4-variable formula (Driver 2017) adds QRSV2 (the total QRS amplitude in V2) on top of those three. The derivation study and the Turkish external validation both show the 4-variable beats the 3-variable, and MDCalc has already replaced the old 3-variable version with the 4-variable one. Don't change a single coefficient.
  • The single most important line: this formula can only "escalate suspicion," not "cancel suspicion." A result below the cutoff doesn't mean you can comfortably send the patient home. If it already looked like an LAD occlusion to you, a low formula result shouldn't overturn that.

Criteria

  • 3-variable formula (Smith 2012): (1.196 × STE60V3) + (0.059 × QTc) − (0.326 × RAV4); STE60V3 and RAV4 in mm, QTc is the computer-read QTc (ms). >23.4 ➜ favors LAD occlusion; ≤23.4 ➜ favors early repolarization.
  • 4-variable formula (Driver 2017): (1.062 × STE60V3) + (0.052 × QTc) − (0.151 × QRSV2) − (0.268 × RAV4); STE60V3, QRSV2, RAV4 in mm, QTc is the Bazett-corrected QT (ms). ≥18.2 ➜ favors LAD occlusion (anterior STEMI); <18.2 ➜ favors early repolarization.
Left side of the slide: segments of V2, V3, and V4, with green rulers marking QRSV2, STEV360, and RAV4; the text in the middle reads, in order (in Chinese), "QRS amplitude in V2", "STE 1.5 small boxes after the J point in V3", "Height of the R wave in V4"; the two columns on the right read "QTc" and "Plug into the equation"
From my 2025 ECG teaching slides for residents at Chi Mei Medical Center (slide 343): how to measure the 4-variable formula's variables, QRSV2, STE60V3 (labeled STEV360 on the slide), and RAV4, then plug them into the equation along with QTc
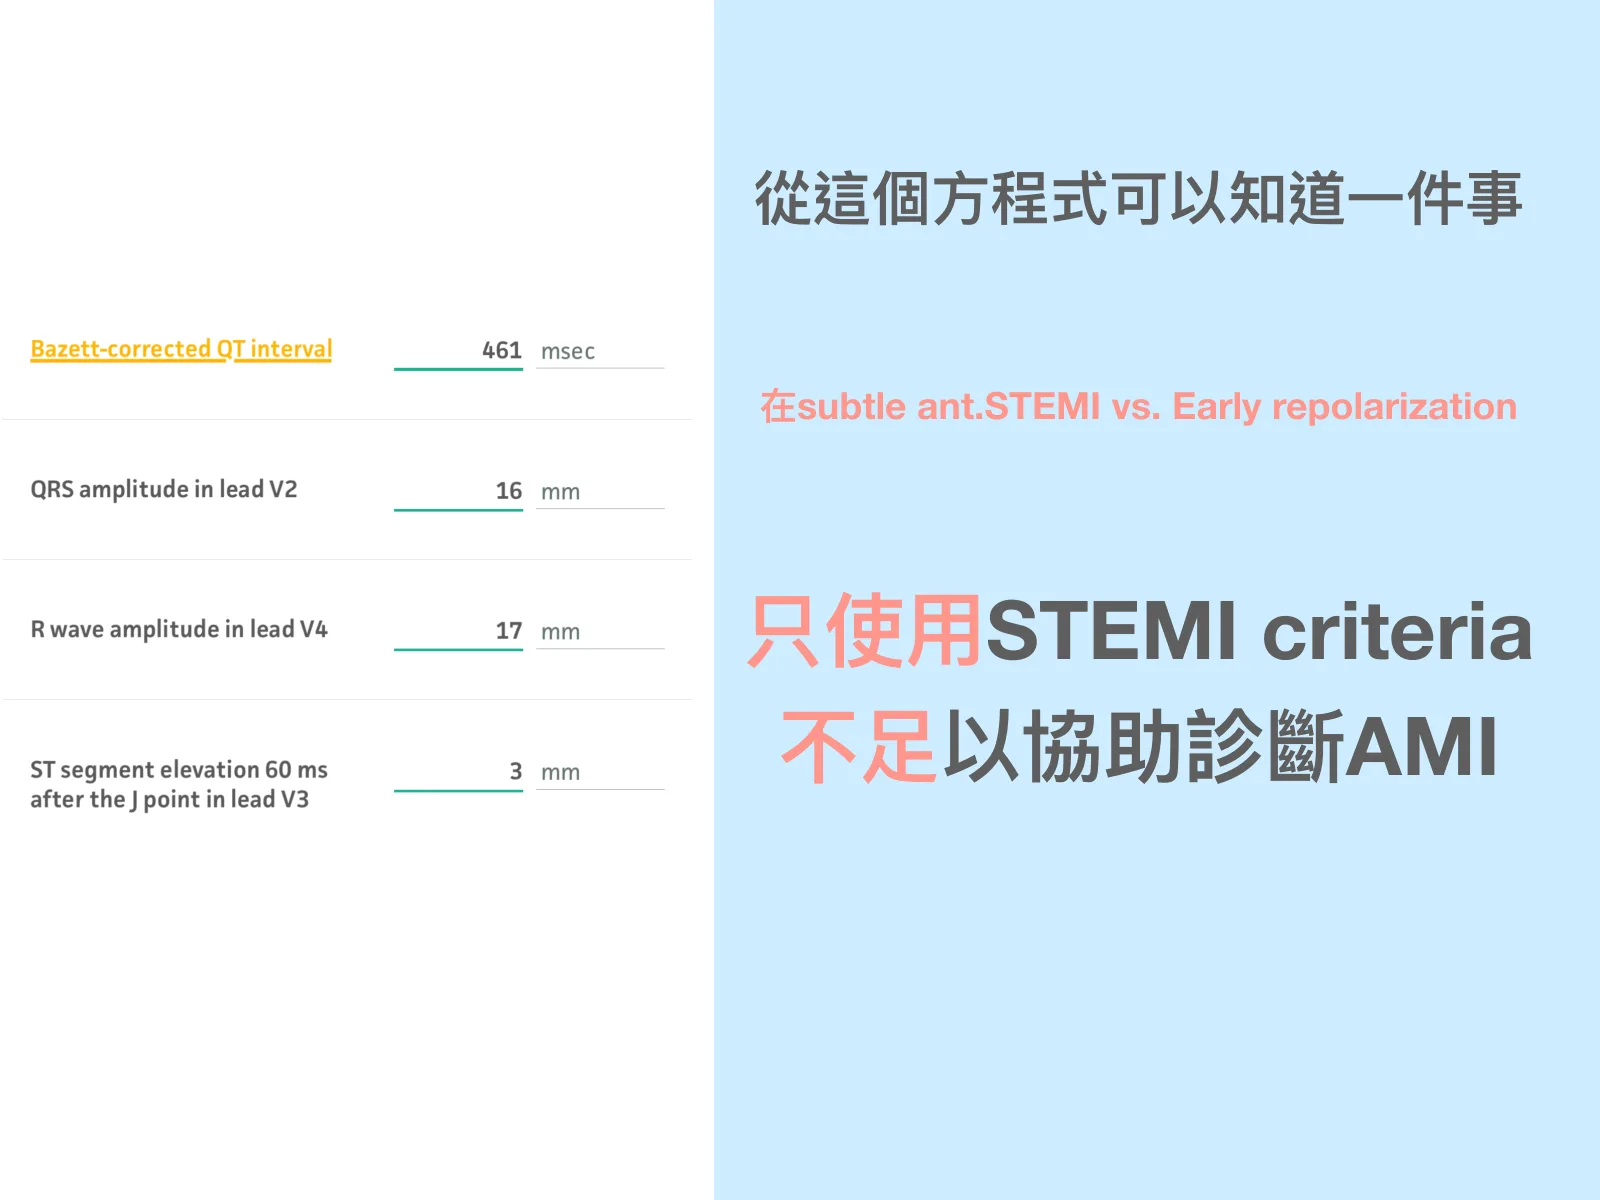
Left side of the slide: a screenshot of the input fields of the MDCalc Subtle Anterior STEMI Calculator (4-Variable): Bazett-corrected QT interval 461 msec, QRS amplitude in lead V2 16 mm, R wave amplitude in lead V4 17 mm, ST segment elevation 60 ms after the J point in lead V3 3 mm (no result shown on screen); on the right, text on light blue (in Chinese): "This equation tells us one thing: in subtle ant.STEMI vs. Early repolarization, STEMI criteria alone are not enough to help diagnose AMI"
From my 2025 ECG teaching slides for residents at Chi Mei Medical Center (slide 345): the input screen of the MDCalc Subtle Anterior STEMI Calculator (4-Variable)

Sources

  1. Smith SW, Khalil A, Henry TD, et al. Electrocardiographic differentiation of early repolarization from subtle anterior ST-segment elevation myocardial infarction. Ann Emerg Med. 2012 Jul;60(1):45-56.e2. PMID 22520989
  2. Driver BE, Khalil A, Henry T, Kazmi F, Adil A, Smith SW. A new 4-variable formula to differentiate normal variant ST segment elevation in V2-V4 (early repolarization) from subtle left anterior descending coronary occlusion - Adding QRS amplitude of V2 improves the model. J Electrocardiol. 2017 Sep-Oct;50(5):561-569. PMID 28460689
  3. Bozbeyoğlu E, Aslanger E, Yıldırımtürk Ö, et al. A tale of two formulas: Differentiation of subtle anterior MI from benign ST segment elevation. Ann Noninvasive Electrocardiol. 2018 Nov;23(6):e12568. PMID 29938879
  4. MDCalc: Subtle Anterior STEMI Calculator (4-Variable)

Special calculations

LBBB/PPM with MSC(+)

Smith-Modified Sgarbossa Criteria

Wide QRS (LBBB / ventricular paced) ➜ go straight to MSC. Scan the three criteria lead by lead; if paced, also scan V4–V6 for concordant STD.

  • In the world of wide QRS, MSC is nearly the only road with literature behind it: in LBBB or ventricular paced patients, STEMI criteria, the 4-variable formula (its premise is distinguishing early repol from LAD occlusion), the HATW score (its derivation study itself excluded patients with a wider QRS), and Precordial Swirl (the first item of its definition is narrow QRS without LVH) are all unusable. Four out, one left: only MSC is backed by three studies, derivation, LBBB validation, and paced validation.
  • Rule of Appropriate Discordance (the seesaw): in LBBB/paced rhythm the ventricles are depolarized through an abnormal pathway, so the ST-T is supposed to point opposite the main QRS direction; that's normal. When you see STE in LBBB, your first reaction shouldn't be "STE ➜ STEMI." Ask first: is this STE "supposed to tip up," or has it "tipped up too far"?
  • What Smith 2012 did, in one line: replaced the absolute 5 mm in the original Sgarbossa third criterion with 25% of the preceding S-wave depth. Seesaws come big and small, so an absolute value isn't fair: LBBB patients without coronary occlusion may also have ≥5 mm discordant STE; a proportion is fair.

Criteria

  • The three MSC criteria (any one = positive; unweighted, no scoring; ST deviation measured relative to the PR segment): ① Concordant STE ≥1 mm (any lead) ② Concordant STD ≥1 mm (V1–V3 in LBBB; expanded to V1–V6 in ventricular paced rhythm) ③ Proportionally excessive discordant STE: in a lead with ≥1 mm discordant STE, STE reaching 25% or more of the preceding S-wave depth (the paper writes ST/S ratio ≤−0.25; the negative sign is because ST and S point in opposite directions).
  • MSC beats the original weighted Sgarbossa (LBBB validation study, Meyers 2015): MSC sensitivity 80%, specificity 99%; significantly more sensitive than the original weighted Sgarbossa, with no statistically significant difference in specificity.
  • Paced rhythm works too (PERFECT study, Dodd 2021): in ventricular paced rhythm, MSC is more sensitive than the original Sgarbossa; MSC plus concordant STD in V4–V6 gives a sensitivity of 86%. MSC specificity falls in the 84%–96% range depending on the control group (84% against the group that got a cath but wasn't OMI, 96% against the general ED control group).
  • The original Sgarbossa criteria (1996), three items: ① concordant STE ≥1 mm ② concordant STD ≥1 mm (V1, V2, or V3) ③ discordant STE ≥5 mm. The original study put these three into a multivariate model to build a scoring system; Smith 2012 considered the rule's diagnostic utility poor, and what he changed was the absolute 5 mm in criterion ③.

Sources

  1. Smith SW, Dodd KW, Henry TD, Dvorak DM, Pearce LA. Diagnosis of ST-elevation myocardial infarction in the presence of left bundle branch block with the ST-elevation to S-wave ratio in a modified Sgarbossa rule. Ann Emerg Med. 2012 Dec;60(6):766-76. PMID 22939607
  2. Meyers HP, Limkakeng AT Jr, Jaffa EJ, et al. Validation of the modified Sgarbossa criteria for acute coronary occlusion in the setting of left bundle branch block: A retrospective case-control study. Am Heart J. 2015 Dec;170(6):1255-64. PMID 26678648
  3. Dodd KW, Zvosec DL, Hart MA, et al. (PERFECT study investigators). Electrocardiographic Diagnosis of Acute Coronary Occlusion Myocardial Infarction in Ventricular Paced Rhythm Using the Modified Sgarbossa Criteria. Ann Emerg Med. 2021 Oct;78(4):517-529. PMID 34172301
  4. Sgarbossa EB, Pinski SL, Barbagelata A, et al. Electrocardiographic diagnosis of evolving acute myocardial infarction in the presence of left bundle-branch block. GUSTO-1 (Global Utilization of Streptokinase and Tissue Plasminogen Activator for Occluded Coronary Arteries) Investigators. N Engl J Med. 1996 Feb 22;334(8):481-7. PMID 8559200
  5. LITFL ECG Library: Sgarbossa Criteria
Subscribe

Notes from the ER floor, every two weeks

ECG cases, AI workflows, and the things you only learn in the ER at 3 AM. Free. Unsubscribe anytime. (Newsletter is written in Traditional Chinese.)

No spam, ever. Unsubscribe with one click. · Subscribers: --